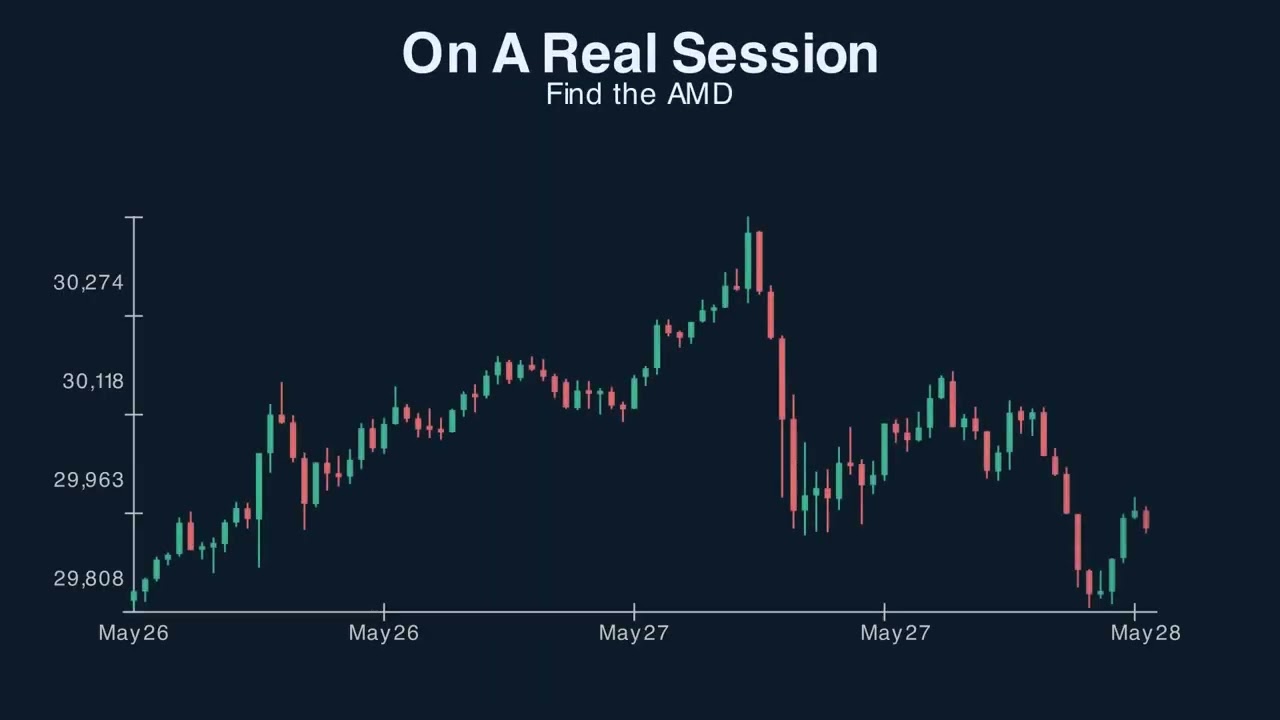
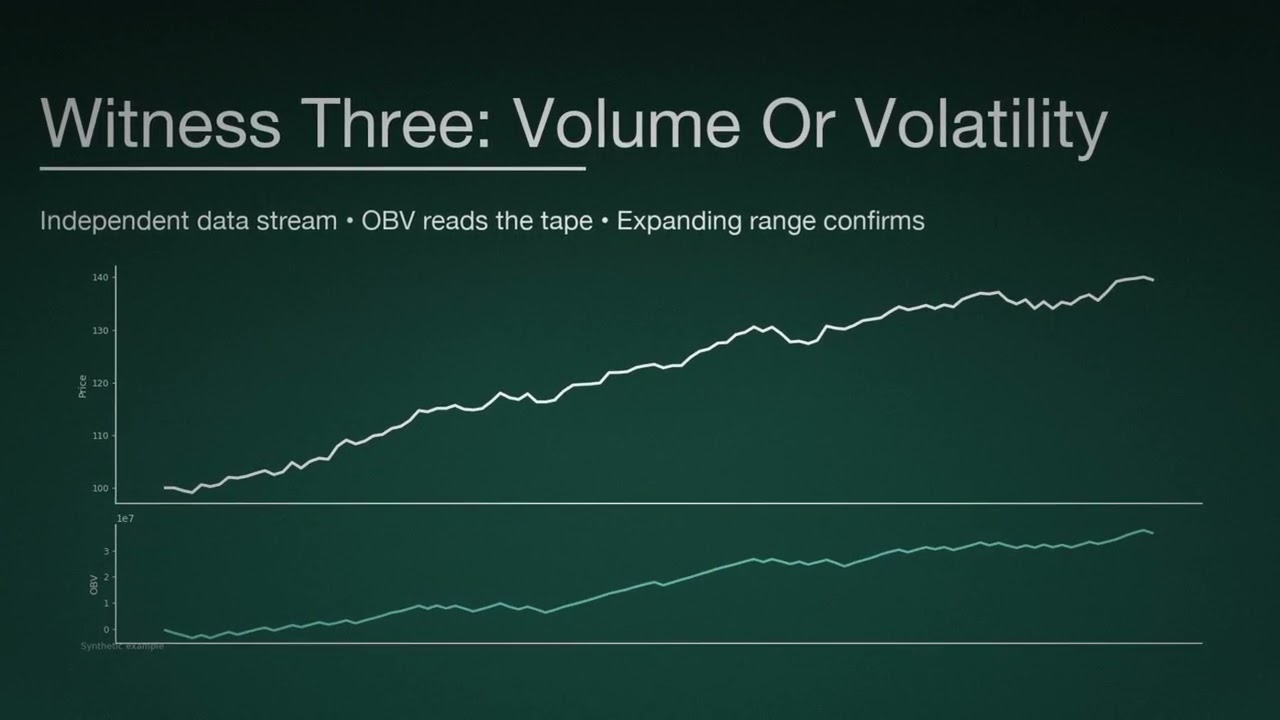
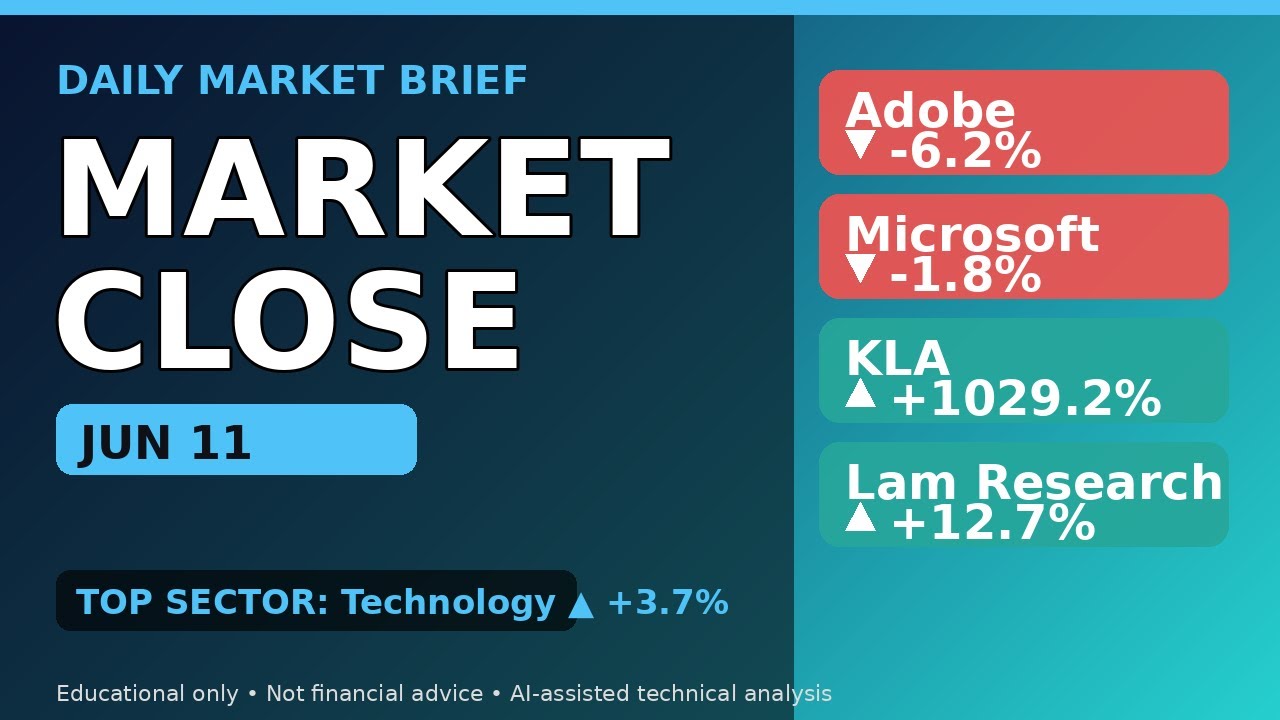
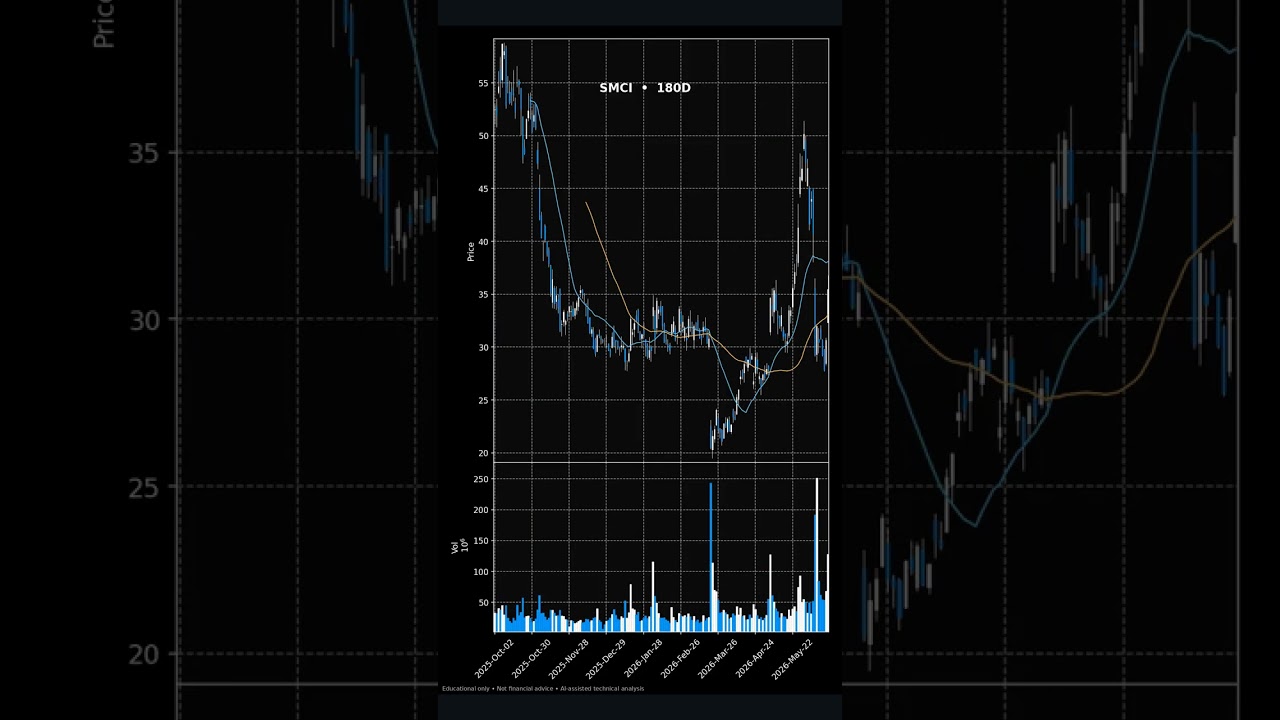
Read the chart's structure first — trend, swing highs and lows, and whether price is building a base or breaking one.
Price action and market structure are the foundation of every Confluence Method trade. Before any indicator, you map the trend with higher highs and higher lows (or the reverse), identify whether price is impulsive or corrective, and locate the structure you are trading from — a base, a pullback, a breakout, or a reversal. Structure tells you the story; the other three signals confirm whether the story is worth a position.
The options Greeks — Delta, Theta, Gamma, and Vega — explained so simply a five-year-old could get them. No scary math: each Greek is just a "mood" that tells you how your option's price reacts to the world.
AI shock, a gold volume explosion, energy leadership, and Netflix getting crushed — Friday's session had something for everyone. Here's what the technical signals picked up.
Massive volume in gold with almost no price move — that's the kind of signal that makes traders stop and look twice. Here's what the technicals showed on July 15.
Sectors rotating, gold volume exploding, and Lucid making a wild move — here is what the market was telling us at Wednesday's close. Wednesday July 15 delivered some sharp moves across the board — BlackRock surged to close out a strong session for financials, Apple caught a bid, and Lucid turned heads with a jaw-dropping run.
Defensive rotation, a gold volume mystery, and Lucid cratering 16% — Wednesday's pre-market is anything but quiet. Here's what the technical signals are showing before the open.
Rotation out of tech and into energy and defensives, gold seeing unusual volume, and Lucid getting crushed. Here is what the pre-market signals are flagging this morning.
CPI drops at 8:30am and markets are already shifting — Oracle sliding, Gold surging on massive volume, and a clear rotation out of tech into defensives. Here is what to watch.
CPI drops at 8:30am and the charts are already telling a story — Oracle oversold, Apple holding a breakout, and Gold screaming for attention. Here's what signals say before the open.
Mega-caps and crypto surged while small caps slipped — here's what the technicals showed across markets this week. It was a strong week for large-cap equities, with Communication Services stealing the show and digital assets adding fuel to the rally.
Growth roared back the week of July 6-10, but small caps got left behind. That divergence between large and small is a technical signal that deserves a closer look.
Meta up 6%, gold seeing 16x average volume, and sectors rotating in ways that don't always show up on the surface. Here's what the automated systems flagged heading into the close.
Bulls closed strong Friday — Meta up 6%, gold volume exploded 16x average, and sector rotation is sending mixed signals heading into the weekend. Friday, July 10 turned into a strong close for the bulls, with Meta surging nearly six percent, S&P 500 futures adding to recent gains, and Nvidia extending its own impressive run.
Costco under pressure, Apple and Arm flashing strength — here is what the technicals and automated signals are showing ahead of Friday's open. Good morning and happy Friday — heading into today's session, Costco Wholesale is under pressure after a sharp drop, while Apple and Arm Holdings are flashing strength that has traders paying close attention.
Bulls took control of the Nasdaq 100 Thursday as tech surged over 2%, gold saw 17x average volume, and traders rotated hard away from defensive sectors. Thursday brought a striking session on the Nasdaq 100, with bulls firmly in control as Costco Wholesale tumbled, Apple held its ground, and Arm Holdings surged into the spotlight.
Alibaba is surging 11% pre-market, gold is seeing 15x its average volume, and sector rotation is telling a story. Here is what the tape looks like before Thursday's open.
Gold trading at 18x average volume while dropping — that kind of extreme activity rarely happens without a reason. Here's what the technicals flagged across today's session.
Energy is rotating, gold is flashing unusual volume, and Cloudflare is surging pre-market. Here is what the technicals are pointing to this Wednesday morning.
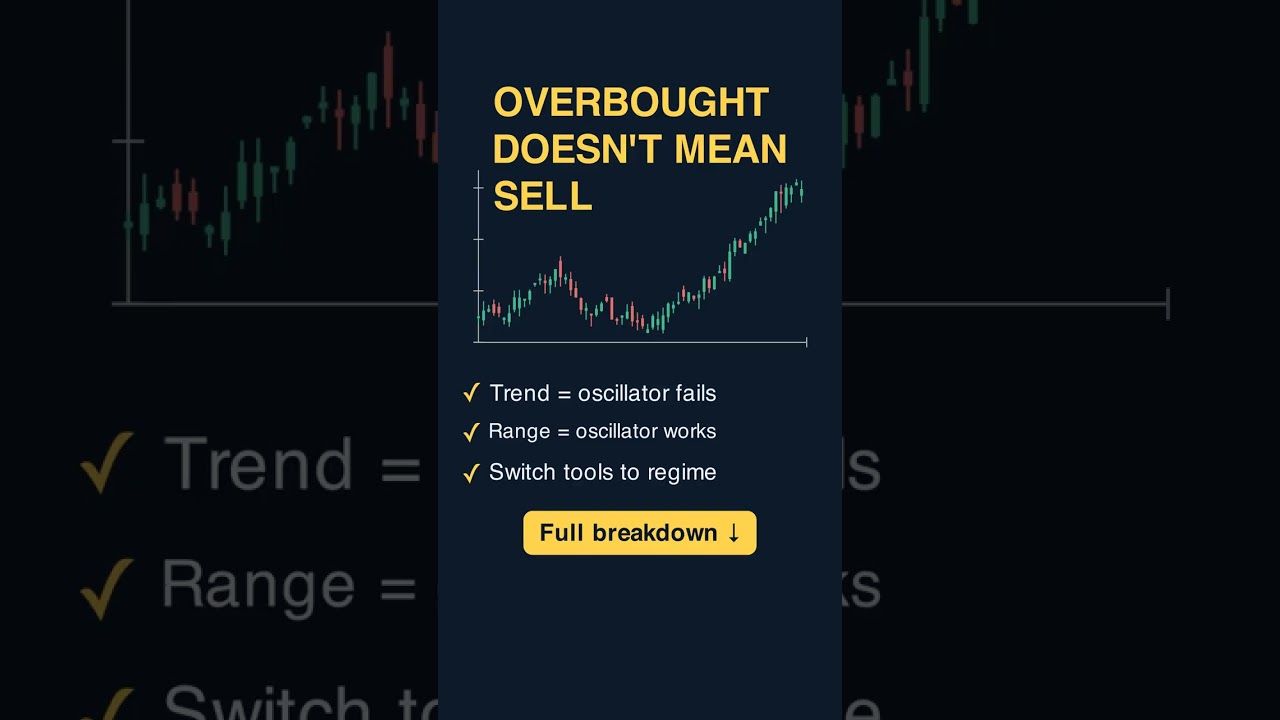
Stochastic overbought doesn't mean sell — in a strong trend it means strength. We break down why every momentum oscillator fails in trending markets, the regime test that separates oscillator-friendly conditions from trend-friendly ones, and how pros switch tools to match the chart.
EV stocks are moving before the bell, gold is seeing extreme volume, and the technicals are flashing signals worth knowing about before markets open Tuesday. Pre-market is lighting up Tuesday July 7th, with electric vehicle names Rivian Automotive and Lucid posting big overnight gains, while Chipotle Mexican Grill is heading in the opposite direction.
Support, Resistance, and Trendlines: The Advanced Playbook Support Resistance is one of the most-used — and most-misused — tools in technical analysis. In this episode we break it down for serious traders: the intuition and the math, how to read it, real entry and exit signals, an analogy that makes it click, a worked example, and the pitfalls to avoid.
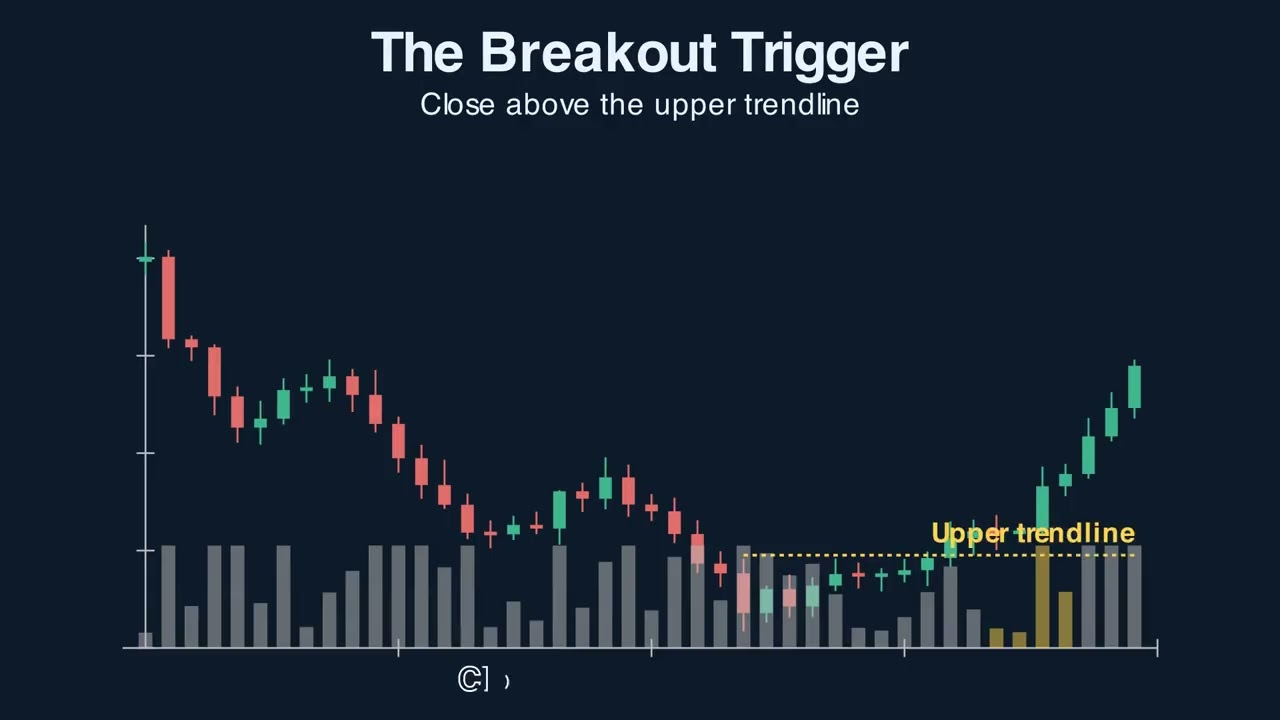
Breakout entries that work: the close-not-the-wick rule, volume confirmation, the false-breakout trap, and the retest entry. The TRIGGER signal of the Confluence Method.
A double top is not two equal peaks — it's two peaks with a specific volume and structural signature. We break down the confirmation rule that separates real double tops from random retests, and why the neckline break (not the second peak) is the actual signal.
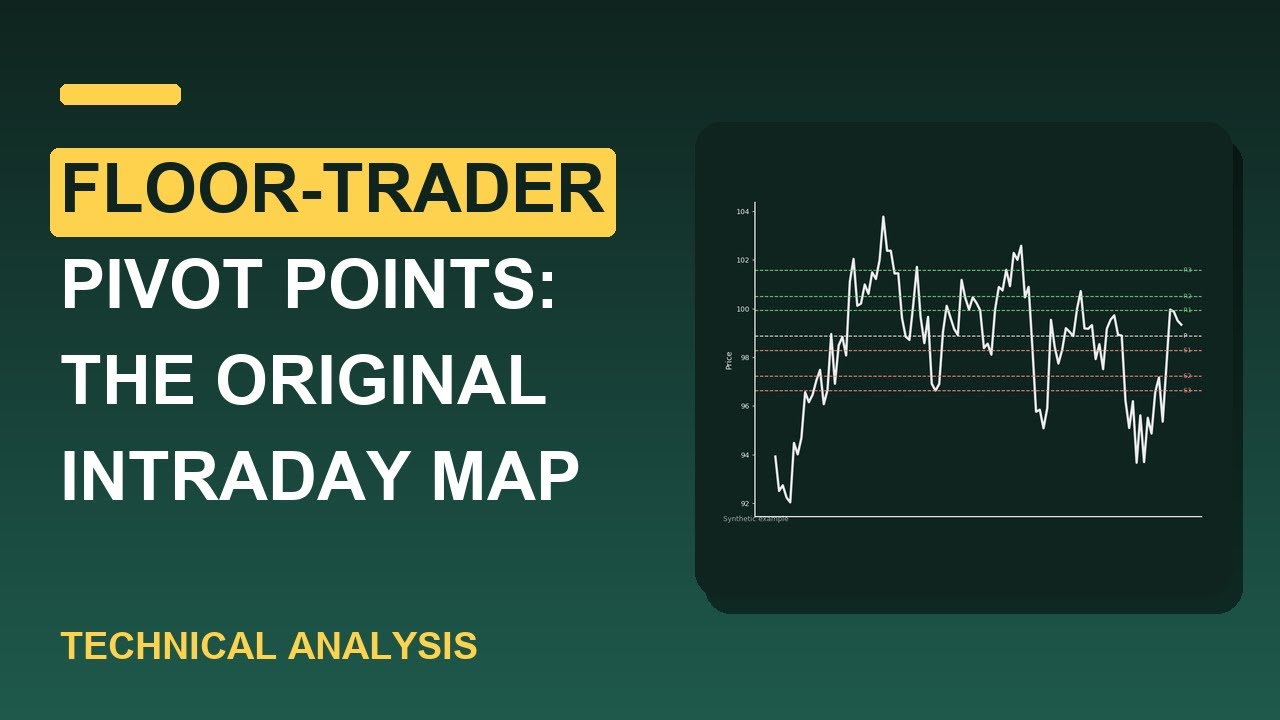
Floor-Trader Pivot Points: The Original Intraday Map Pivot Points is one of the most-used — and most-misused — tools in technical analysis. In this episode we break it down for serious traders: the intuition and the math, how to read it, real entry and exit signals, an analogy that makes it click, a worked example, and the pitfalls to avoid.
Health Care exploded nearly 10% while the Nasdaq dropped 4% the same week. The rotation signals from this week's technical read are worth understanding.
Head and shoulders is the most famous reversal pattern — and the most misidentified. We break down the structural rules that separate real H&S from lookalikes, the volume profile that confirms the pattern, and the neckline-break filter that turns a textbook pattern into an actual trade.
Defensives surged, tech got hit, and gold volume exploded 14x today — the under-the-surface action this holiday week is telling a story worth paying attention to. It was a split session to close out the short holiday week, with Rivian Automotive surging, Robinhood Markets pushing higher, and Apple catching a meaningful bid even as the broader tape showed some real fault lines.
Pre-market is anything but quiet this Fourth of July eve. Jobs data drops at 8:30, defensives dominated yesterday, and gold saw a massive volume spike.
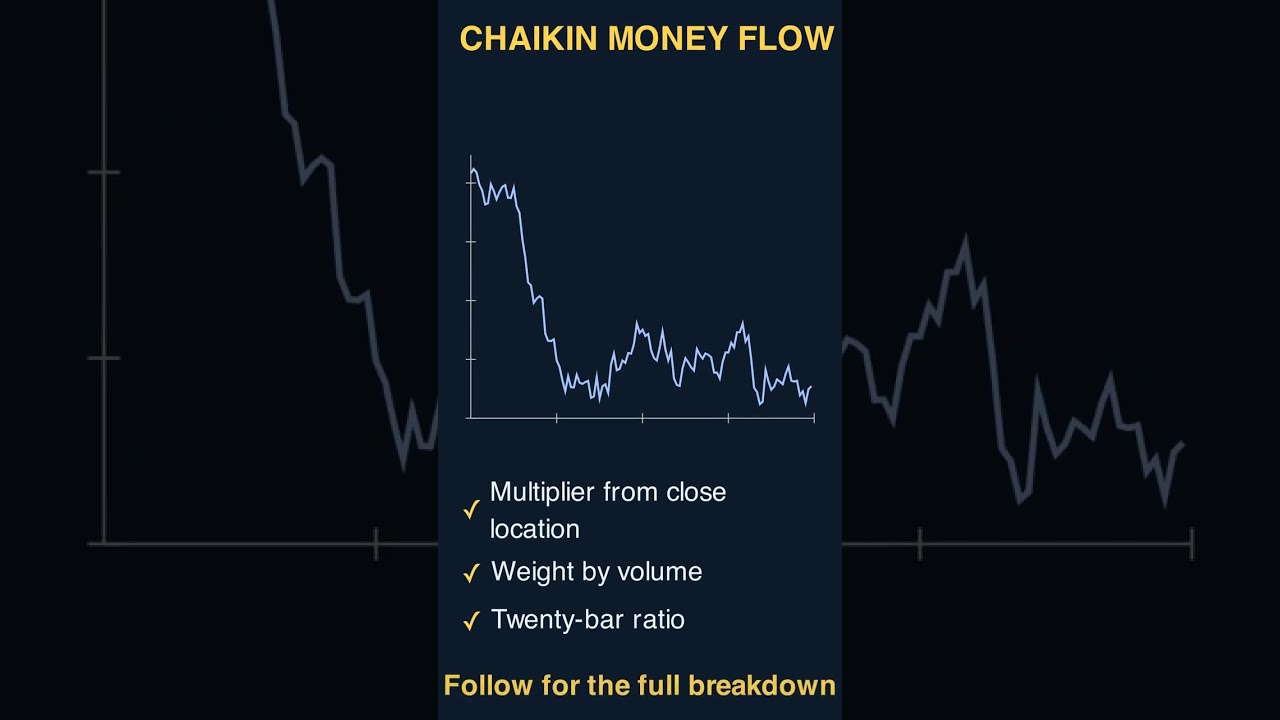
Chaikin Money Flow: Reading Volume Conviction Chaikin Money Flow is one of the most-used — and most-misused — tools in technical analysis. In this episode we break it down for serious traders: the intuition and the math, how to read it, real entry and exit signals, an analogy that makes it click, a worked example, and the pitfalls to avoid.
Defensives up, tech down, gold surging on massive volume — Thursday's close had a clear story. Here's what the technicals are saying before the holiday weekend.
Crude oil sliding, Super Micro getting hit, and Coinbase up nearly 9% — Thursday's pre-market is moving. Here's what the technical signals are showing before the bell.
Bollinger Bands done right: volatility envelopes, mean reversion in a range, the band-ride trap in a trend, and the squeeze that precedes the big move. Educational only, not financial advice.
Gold surging at 17x average volume while tech sells off and crude slides — Wednesday's session had a lot to say about where risk appetite stands right now. Wednesday's close told two very different stories — crude oil futures slid deeper into oversold territory while Coinbase Global and Meta surged, pulling risk appetite firmly back into the spotlight.
USMCA deadline day is here — tech is surging, defensives are sliding, and gold just saw nearly 14x its average volume. Here is what the technicals are signaling.
Roblox is surging double digits, Lucid is popping nearly 10%, and the market just had a strong risk-on session. Here is what the technicals are showing before the open.
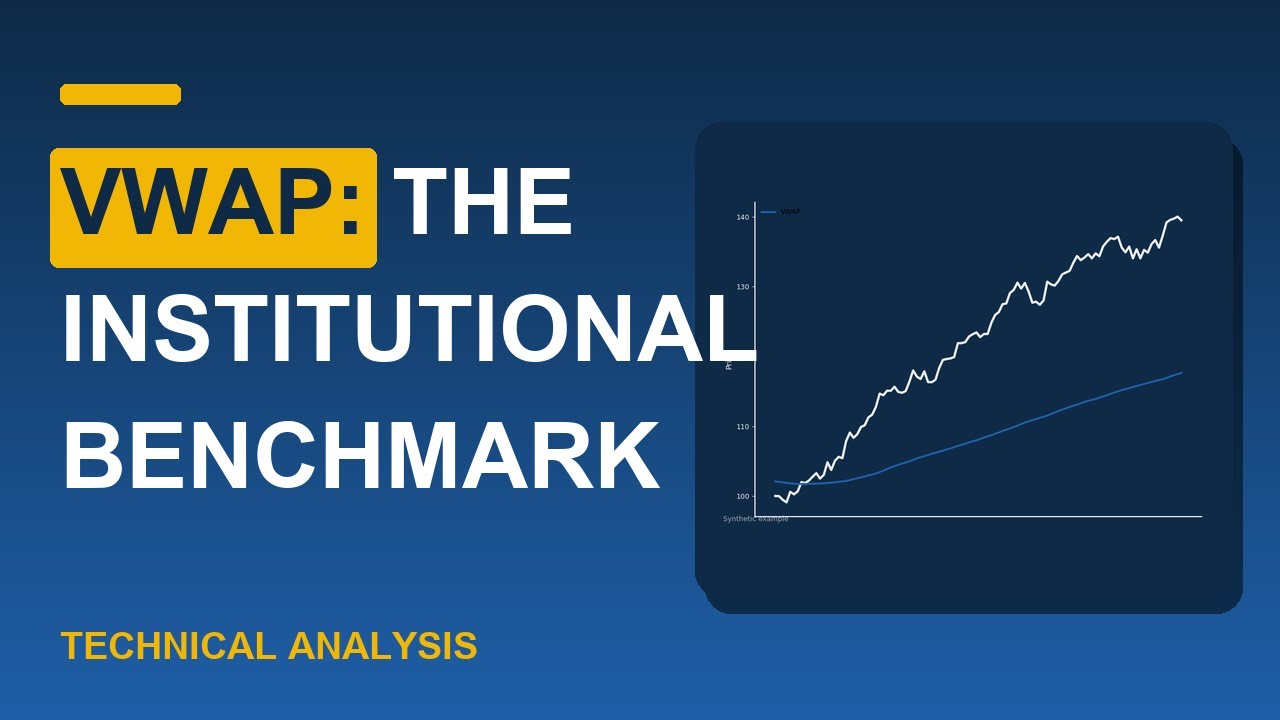
VWAP: The Institutional Benchmark VWAP is one of the most-used — and most-misused — tools in technical analysis. In this episode we break it down for serious traders: the intuition and the math, how to read it, real entry and exit signals, an analogy that makes it click, a worked example, and the pitfalls to avoid.
Defensive sectors dominated Friday while AbbVie surges, ON Semi gets crushed, and Lucid turns heads. Here is what the technical signals are showing this Monday morning.
Most cup-and-handle 'patterns' are bad cup-and-handles — base too deep, handle too sloppy, volume profile wrong. We break down what makes a textbook cup and handle, the structural rules that separate real bases from sloppy ones, and the volume confirmation that turns the pattern into a trade.
Reading Volume Spikes for Confirmation OBV is one of the most-used — and most-misused — tools in technical analysis. In this episode we break it down for serious traders: the intuition and the math, how to read it, real entry and exit signals, an analogy that makes it click, a worked example, and the pitfalls to avoid.
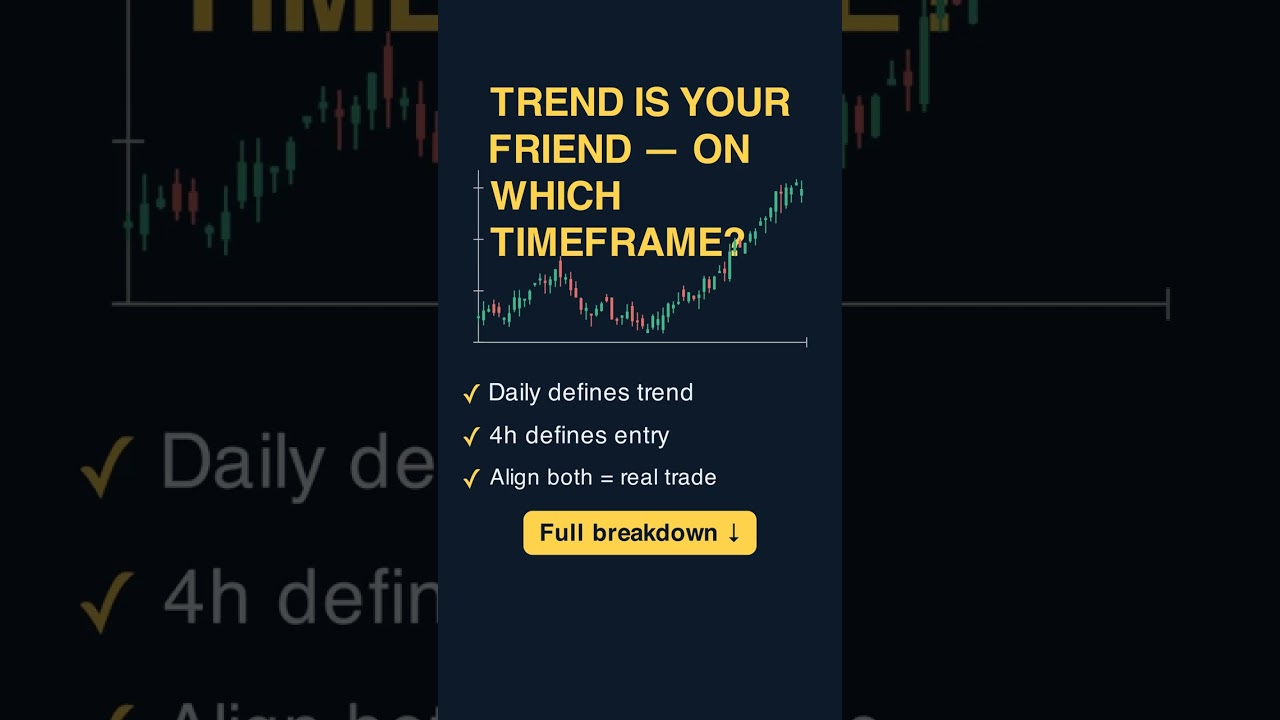
'The trend is your friend' is famous advice — and incomplete advice. Without specifying which TIMEFRAME's trend you mean, the rule produces contradictions: uptrend on the daily and downtrend on the four-hour.
Gold surging 16x its average volume while tech sold off hard — Friday's tape sent some clear signals worth paying attention to this weekend. Friday's close brought some sharp moves to watch, with ON Semiconductor and Cisco Systems getting hit hard while Lucid surged double digits.
Friday's tape had winners, losers, and a defensive rotation that technical systems are flagging — Gold surged on massive volume while Tech sold off. Here's what the data showed.
Industrials surging, gold seeing 14x normal volume, and a chip headline out of Korea rattling pre-market — here is what the technicals are flagging before the open. It is Friday June 26 and pre-market trade is split right down the middle — Apple and Microsoft are nursing sharp losses while Micron Technology is surging after what appears to be a strong catalyst overnight.
Micron surges double digits while Apple and Microsoft slide, Korean chips halted overnight, and gold is trading at 14x normal volume. The rotation is real and it is happening now.
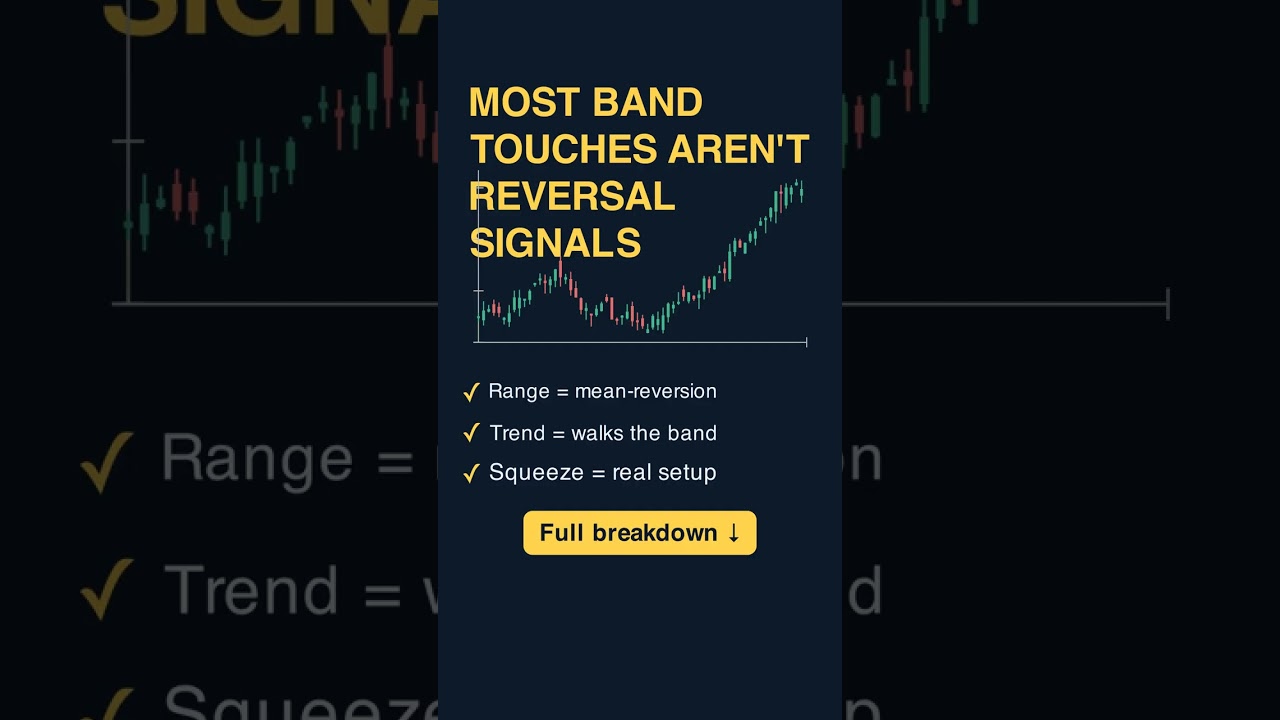
Most beginners short every Bollinger Band touch on the upper band and buy every touch on the lower band — and lose money. We break down the difference between mean-reversion regimes and walking-the-band trend regimes, the squeeze setup that actually has an edge, and how to combine Bollinger Bands with regime filters that work.
Rotation into defensives, gold surging 12x average volume, and BlackRock flashing a breakdown — your pre-market technical read is live now. Good morning and welcome to your pre-market brief for Thursday, June 25.
Backtests look beautiful in a spreadsheet and fail in real money. We break down the three biases that inflate every backtest — survivorship, lookahead, overfitting — and the realistic adjustments that turn paper results into production-grade expectations.
Gold just hit oversold territory with 12x average volume — that kind of conviction behind a move is exactly what technical traders watch for. Here's what the signals are saying.
RSI for swing traders: what it measures, why overbought isn't a sell signal in a trend, and how divergence front-runs reversals. The MOMENTUM signal of the Confluence Method.
The mirror of the classic top: a downtrend prints three lows, the middle deepest, then breaks the neckline to launch a new uptrend. Anatomy, the one trigger that matters, the measured-move target, and the trap of buying too early.
Defensive sectors surged while tech cratered over 4% — the rotation signal technical analysts watch closely when risk appetite starts to shift. Tuesday, June 23 was a tale of two markets — crude oil futures extended their slide while names like Merck and Target bucked the broader pressure with solid gains.
Tech is cracking while energy and health care hold firm — Microsoft sliding over 3% pre-market as automated signals flag a potential breakdown. Here is what the tape is saying.
Step-by-step tutorial on using AI to decode Fed FOMC statements: word-by-word comparison to prior statement, tone shift detection, dot plot summarization. Get the signal in 2 minutes.
Step-by-step tutorial on using AI to summarize earnings call transcripts: extract guidance changes, management tone shifts, and analyst Q&A red flags in minutes instead of hours. Educational only, not financial advice.
A volume spike isn't automatically bullish or bearish — context decides. We break down the difference between climax volume (exhaustion) and continuation volume (strength), the location filter that separates them, and how pros read volume spikes correctly.
Semiconductors are shaking up, growth sectors are pulling capital, and gold is flashing a strange signal. Here is what the pre-market is telling us before Monday's open.
A pullback that looks bearish but is actually bullish: converging trendlines, drying volume, then the breakout that launches the next leg. The falling-wedge anatomy, the volume tell, the trigger, and the trap of trading it before the break.
Doji candles are taught as reversal signals — and most aren't. We break down what a doji actually means (indecision, not reversal), the location-based filter that separates a doji at a key level from a doji in the middle of nowhere, and how pros trade doji confluence.
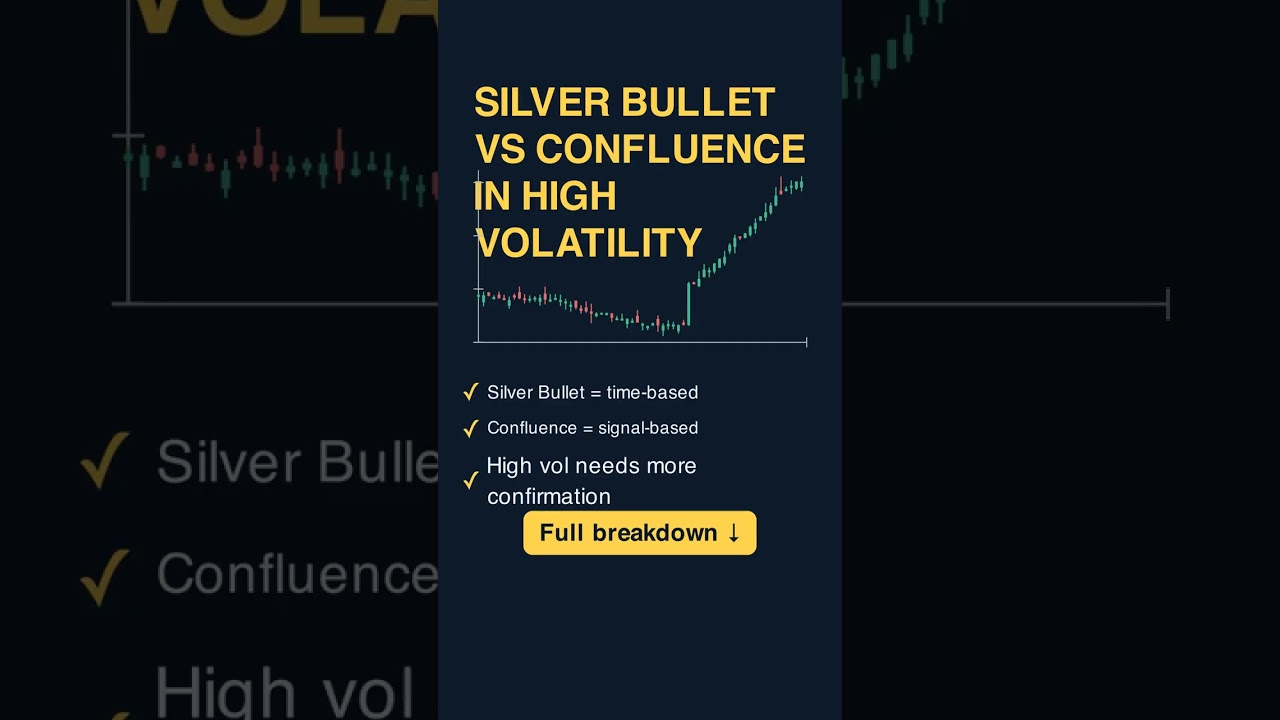
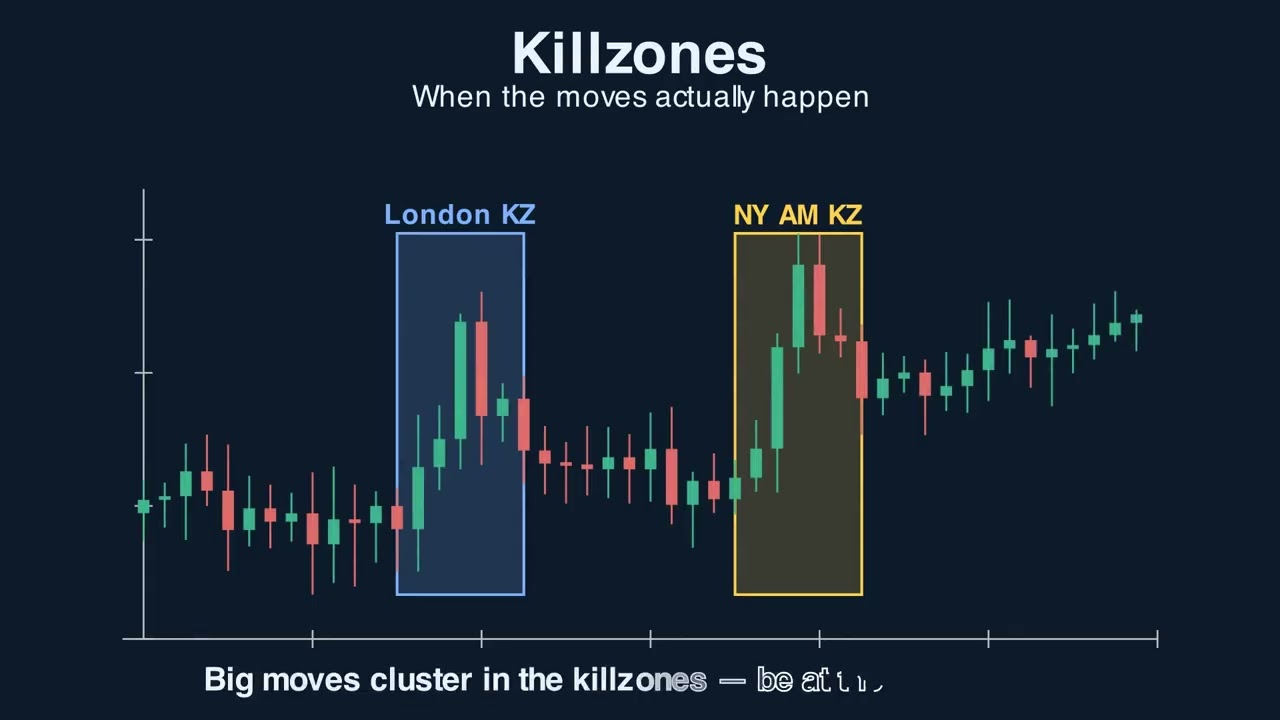
ICT Silver Bullet fires every day in the 10-11 AM New York window — but rigid time windows break down when volatility spikes. We compare the time-based Silver Bullet to the signal-based Confluence Method on a high-volatility session, showing why multi-factor confirmation (Anchored VWAP + key level + momentum + trigger) wins when single-factor liquidity sweeps lose.
Semis took over the market this week. Nasdaq 100 up 5%, Russell close behind — here's what the technicals are actually saying about risk appetite right now.
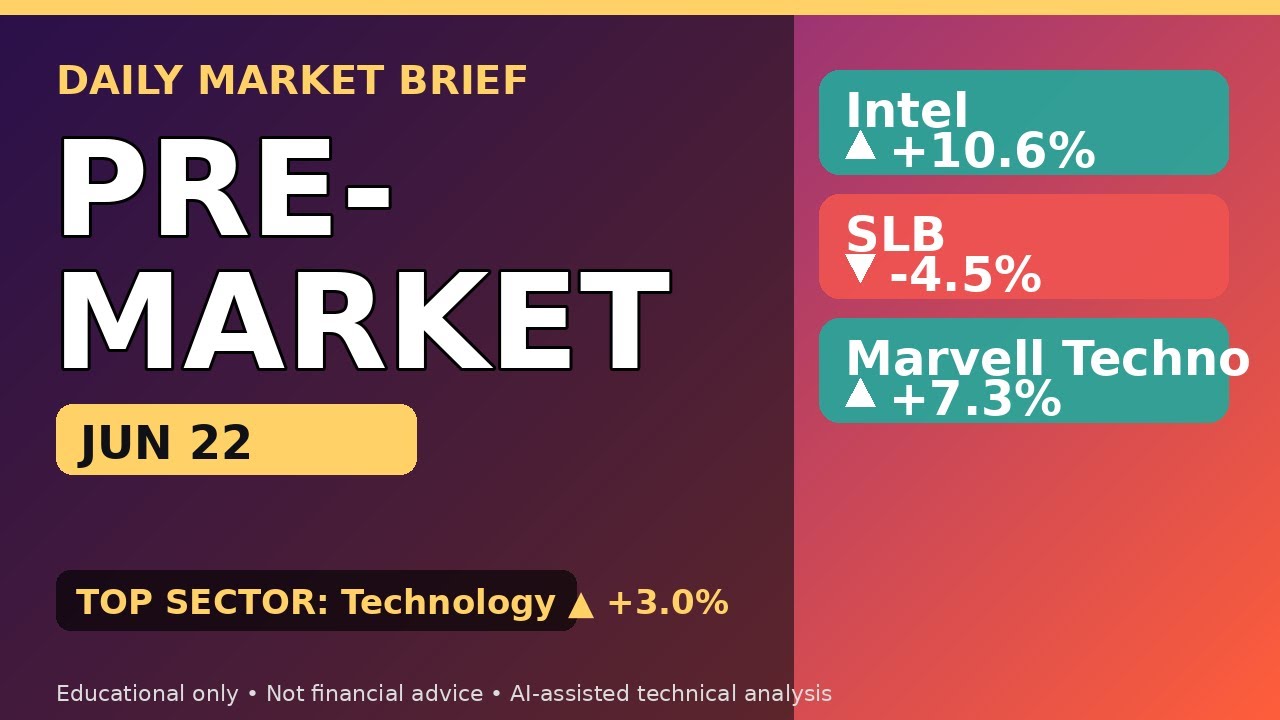
Quadruple witching Friday saw Intel surge, sectors rotate hard, and gold sellers show up with serious conviction. Here is what the technical signals picked up.
Your average winner size in R-multiples reveals what kind of strategy you actually have — and what win rate it needs to be profitable. We break down the math.
Three failed lows is the market screaming the floor is in. We break down the anatomy of a triple bottom, the volume signature that confirms it, the neckline trigger, and the trap of buying the third test instead of waiting for the breakout.
Pivot points are taught as automatic intraday support and resistance — and most fail. We break down why pivots are reference lines, not levels, the confluence filter that separates real pivot defense from random math, and how pros use pivots as confirmation rather than entry triggers.
The bull pennant is the bull flag's faster, tighter cousin — sharper pole, narrower pause, more violent breakout. We break down the anatomy, the volume signature, how to tell it apart from a flag, and the trap of trading wide pennants.
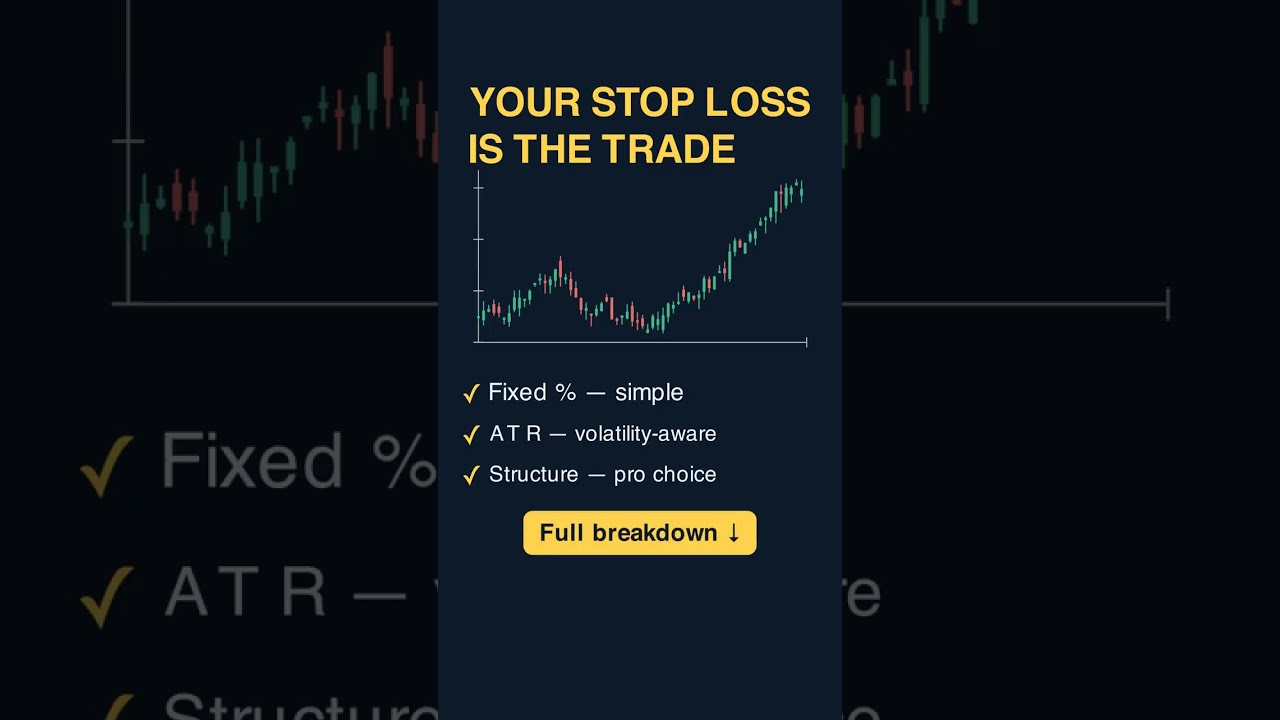
Where you put your stop is the trade. We break down the three stop-loss methods that work — fixed-percent, ATR-based, and structure-based — when to use each, and the single biggest trap that turns winning trades into losers.
Robinhood surged 9%, gold traded at 11x normal volume, and sectors rotated hard. Here is what the technical signals flagged on a rough Wednesday close.
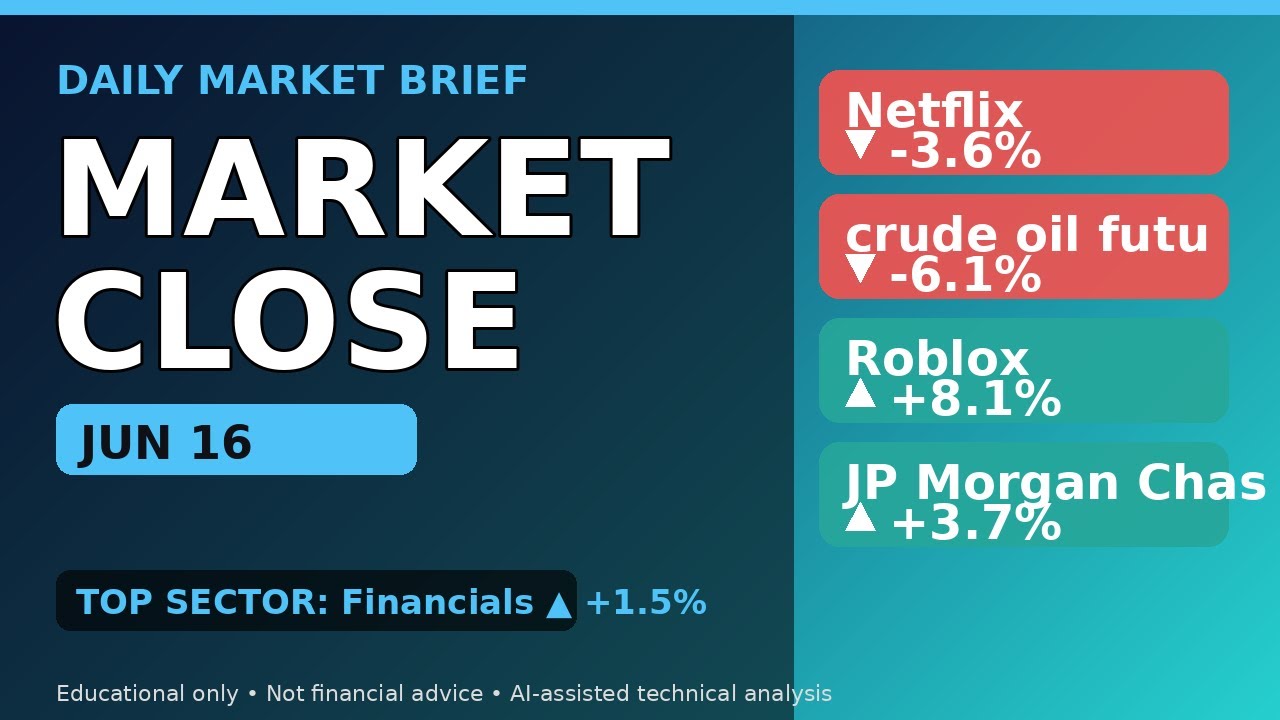
Fed day is here — rotation into defensives, gold surging on volume, and one rate decision at 2pm that could flip the script on everything. Wednesday June 17 — Roblox is surging pre-market, JP Morgan Chase and Co.
Turtle Soup is the failed-breakout reversal that punishes breakout traders. We break down the 20-day high sweep, the immediate failure, the entry and stop, and the one filter that keeps you from taking it in a trend.
Most beginners draw Fibonacci retracements between random highs and lows, then act shocked when the levels don't hold. We break down what makes a Fib draw meaningful, the confluence filter that turns Fib from decoration into a real level, and why the golden zone only works when something else agrees.
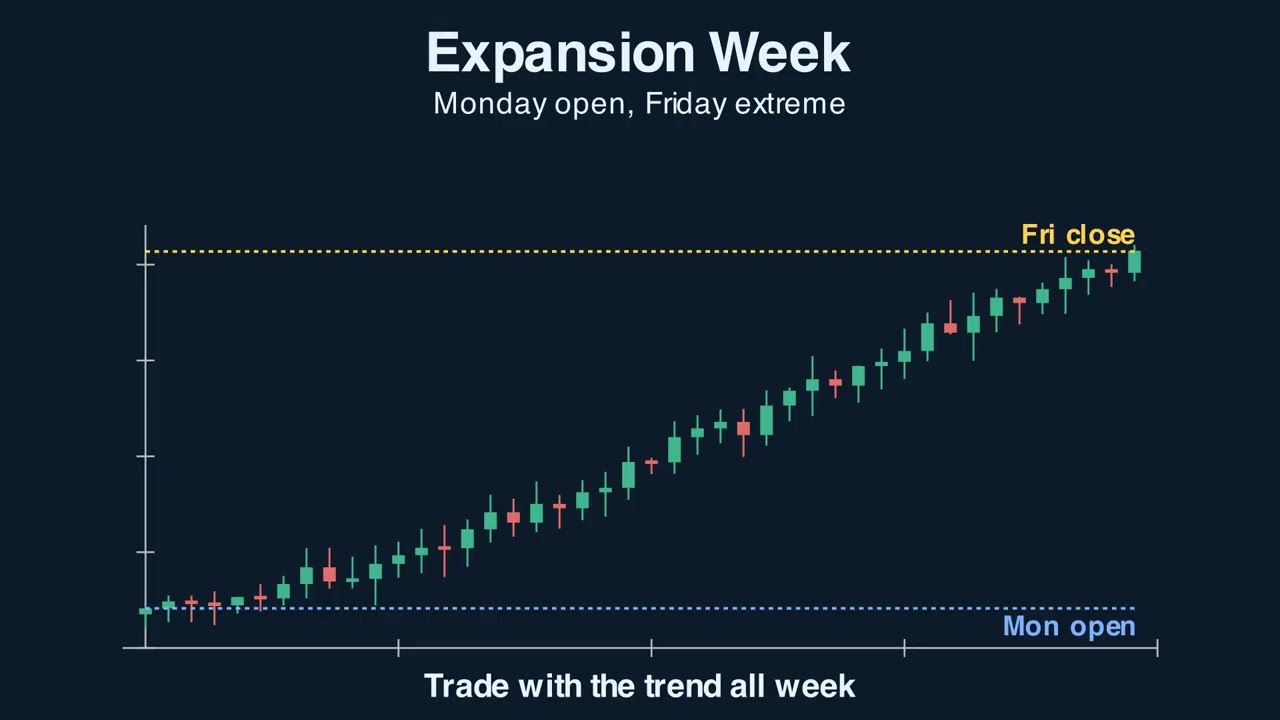
Four weekly templates that explain almost every week in the market: consolidation, expansion, reversal, and seek-and-destroy. We break down the anatomy, how to identify the template by Tuesday or Wednesday, and the bias each one gives you.
Tech dropped 3%, gold saw 8x average volume, and rotation into financials raised eyebrows. Tuesday's technical signals told a story worth paying attention to.
Quarterly Theory: every session breaks into four 90-minute cycles, and each cycle delivers an accumulation-manipulation-distribution-reversal sequence. We break down the quarters, the true open of each cycle, and how to use them to time entries.
The Fair Value Gap explained the ICT way: what a three-candle imbalance is, why price returns to rebalance it, how to enter, why displacement matters, and the gaps you should ignore. Educational only, not financial advice.
Fear is fading on Wall Street — tech surged, energy tanked, and gold is seeing unusual volume. Here is what the technicals are showing after today's sharp rotation.
Sharp moves before the open — Adobe sliding, Arm surging double digits, and gold trading at 7x average volume. Here's what the technicals are signaling.
Round numbers feel like support and resistance, but most aren't. We break down why round numbers act as magnets without acting as floors, the confluence filter that separates psychological levels from structural levels, and how to trade round numbers only when the chart actually agrees.
Divergence is the most over-trusted signal in technical analysis. We break down why most divergences DON'T lead to reversals, the confluence filter that separates real exhaustion from random noise, and how to combine divergence with structure breaks for entries that actually work.
Building Indicator Confluence: Stacking Edge Without Stacking Noise Moving Averages is one of the most-used — and most-misused — tools in technical analysis. In this episode we break it down for serious traders: the intuition and the math, how to read it, real entry and exit signals, an analogy that makes it click, a worked example, and the pitfalls to avoid.
Tech sold off hard while Real Estate, Staples, and Health Care surged. The data shows a textbook rotation signal — and the Nasdaq-Russell spread tells the story.
Gold surging on 10x volume, Adobe down 7%, Arm up double digits — Friday's session had traders watching some major technical signals across the board. Friday's close brought some sharp moves worth unpacking — Adobe got hit hard, crude oil futures slid under pressure, and Arm Holdings surged double digits to steal the show.
Chip stocks are surging, Oracle is sliding, and gold is seeing 7x normal volume. Here is what the technical signals are showing across markets this Friday pre-market.
Every beginner trader learns the golden cross — 50-day crossing above 200-day equals bull market. The reality is the signal lags badly, fires after most of the move is over, and produces whipsaws in sideways markets.
Tech surged nearly 4% Thursday but Oracle cratered 8. 5% on heavy volume and Adobe wasn't far behind — the market had some serious winners and losers today.
Thursday pre-market is moving fast. Defensive rotation, extreme gold volume, and big movers already in play — here's what the technicals are showing before the open.
Gaps are the market shouting what it usually whispers — and most traders read them backwards. We break down the three gaps that matter, why the gap fill is the highest-percentage swing setup, the exhaustion gap that traps chasers, and how to use volume to tell them apart.
Most support lines on most charts aren't actually support — they're random horizontals the trader drew. We break down what makes a level REAL (volume traded at the price, multiple touches, structural relevance), the trap of drawing lines that look right but have no participants behind them, and how to combine price levels with volume nodes for confluence support that actually holds.
Gold futures are flashing oversold while CPI drops at 8:30 — today's inflation print could reprice everything. Here's what the technical signals are showing.
The bull flag, the Confluence way — pole, flag, breakout shown on animated charts, then proven on real NVDA daily price. Volume + RSI confirmation, the exact entry, the stop, and the measured-move target.
The reason your winners aren't bigger isn't entry timing — it's exit psychology. We break down why traders take profit too early, the measured-move math that gives you a real target, and the structure-based profit-taking system the pros use to let winners actually run.
The first thirty minutes set the day. We break down the opening range, the breakout trigger that catches the real move, the volume and trend filters that double the win rate, and the fake-out trap.
Gold stumbled on 10x average volume while real estate led and tech dropped nearly 2%. Tuesday's tape showed a market pulling hard in opposite directions.
Semis are moving, gold is spiking on big volume, and tech is leading while defensives fall behind. Here is what the automated signals are flagging before Tuesday's open.
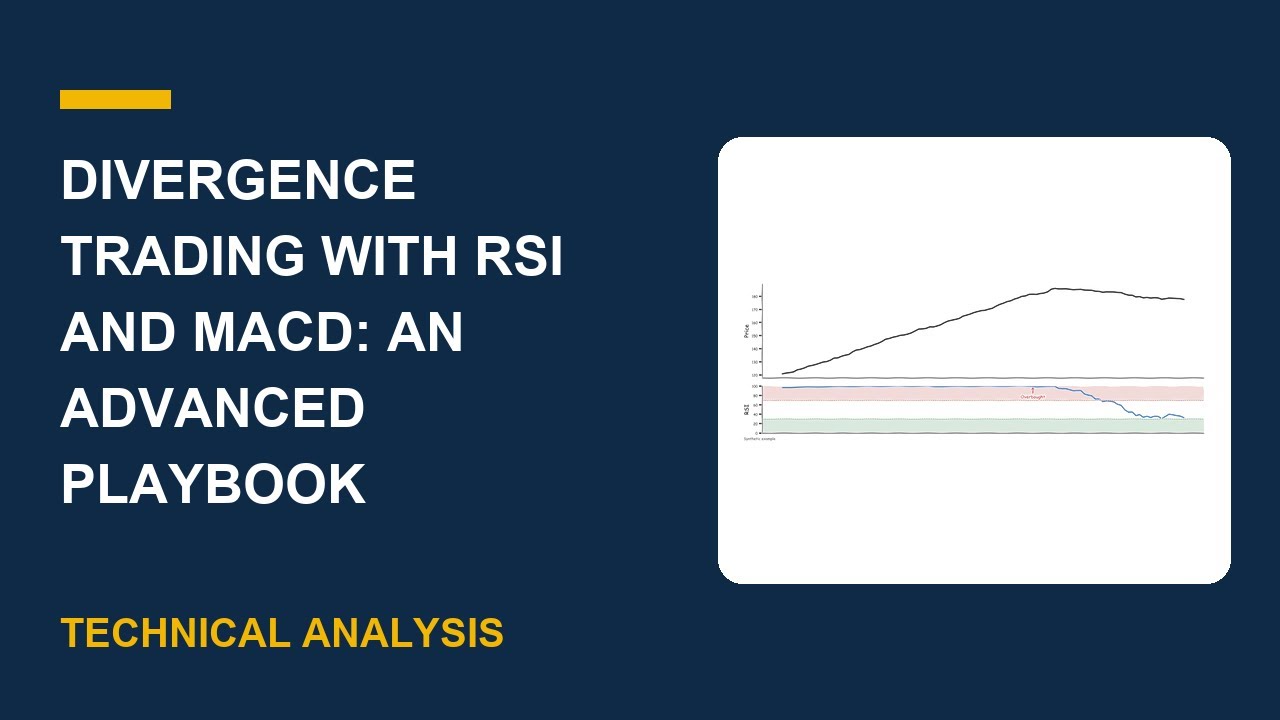
Divergence Trading with RSI and MACD: An Advanced Playbook Divergence is one of the most-used — and most-misused — tools in technical analysis. In this episode we break it down for serious traders: the intuition and the math, how to read it, real entry and exit signals, an analogy that makes it click, a worked example, and the pitfalls to avoid.
Massive rotation into tech and cyclicals, gold trading at 11x normal volume on a tiny price move — Monday's session had some unusual signals worth understanding. Monday's close had some real divergence under the hood — Amazon slipped while Intel and Micron Technology surged double digits, making this a session worth breaking down.
Defensive rotation, safe-haven spikes, and a Nasdaq selloff with serious volume behind it — here is what the technical signals are showing heading into Monday's open. Good morning and welcome to the pre-market breakdown for Monday, June 8th.
Most swing traders die on the wrong timeframe. We break down the top-down framework — weekly bias, daily trigger, four-hour entry — the rule that keeps you from fighting the trend, and the trap of confirmation-stacking.
Most trend lines are drawn on noise, not signal — and break almost immediately. We break down what makes a trend line VALID (three touches, real swing structure, appropriate timeframe), the trap of drawing lines that look right but aren't, and how to combine trend lines with horizontal levels for confluence entries that hold.
Volume is the conviction behind price: why breakouts need volume, how rising volume confirms a trend, and how to spot the low-volume move that's about to fail. Part of the momentum signal in the Confluence Method.
Crypto got crushed, small caps slid, and even the Nasdaq felt the heat — but one quiet sector quietly led the week. Here's where the money actually moved.
Moving averages for swing traders: what the slope and the crossover really tell you, the MA as dynamic support in a trend, and the range whipsaw to avoid. The price-action / structure signal of the Confluence Method.
Buying R S I under 30 in a downtrend is how accounts die slowly. We break down why oversold isn't a buy signal when the trend is against you, the one filter that separates real reversals from value traps, and how to combine R S I with the 50-day moving average for confluence entries that actually hold.
Defensives up, tech crushed, crypto cratered — Friday's session showed a textbook risk-off rotation with some big moves backed by heavy volume. Gold futures took a hard hit today, Bitcoin cratered nearly five percent, and Chipotle Mexican Grill bucked the broader selloff with a solid gain.
Your MACD crossover signal works in chop and lies in strong trends. We break down why the signal that everyone trusts produces nothing but whipsaws in directional markets, the one filter that fixes it, and how to combine MACD with R S I and structure for confluence signals that actually hold.
Market structure decoded: higher highs and higher lows define a trend, break of structure signals the shift, and change of character warns first. The price-action signal of the Confluence Method.
Fibonacci retracements done right: the key levels, the golden pocket at 61. 8%, why fibs only work with confluence, and how to use them to time pullback entries.
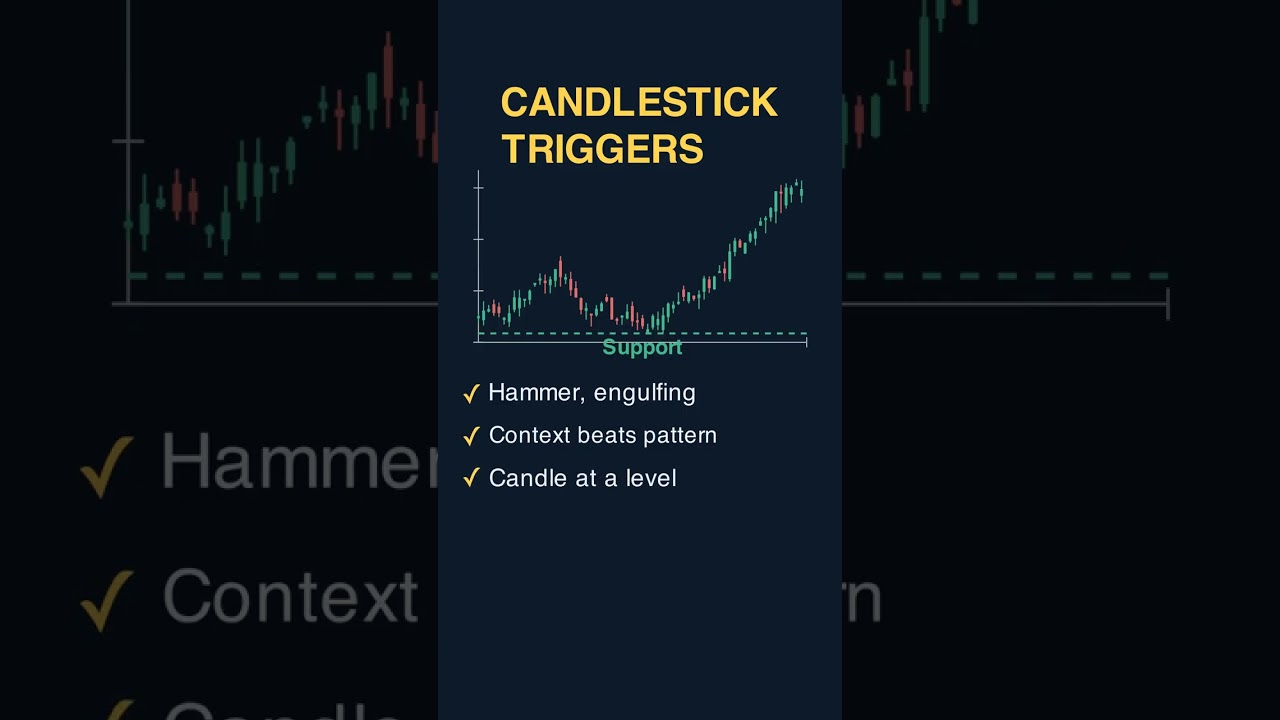
Candlestick triggers that work: hammer, engulfing, shooting star and doji — and why they only matter at a key level, never in the middle of nowhere. The trigger signal of the Confluence Method.
Indicators don't lie about the past — they lie about the future, and each one does it in a specific, math-driven way. This episode breaks down the three failure modes you can't optimize away: lag (a 50 SMA trails by ~25 bars), false signals (MACD whipsaws in range), and repainting (ZigZag, Ichimoku spans, and unclosed-bar crossovers that vanish by the close).
The ascending triangle: a flat resistance, rising lows, and the breakout that follows. Anatomy, the entry/stop/target, the early-entry trap, and a real chart.
On-Balance Volume: Reading Accumulation Before Price Moves OBV is one of the most-used — and most-misused — tools in technical analysis. In this episode we break it down for serious traders: the intuition and the math, how to read it, real entry and exit signals, an analogy that makes it click, a worked example, and the pitfalls to avoid.
The pullback entry: in a healthy uptrend, buy the dip into the rising moving average instead of chasing the breakout. Anatomy, the exact entry/stop/target, the falling-knife trap, and a real chart.
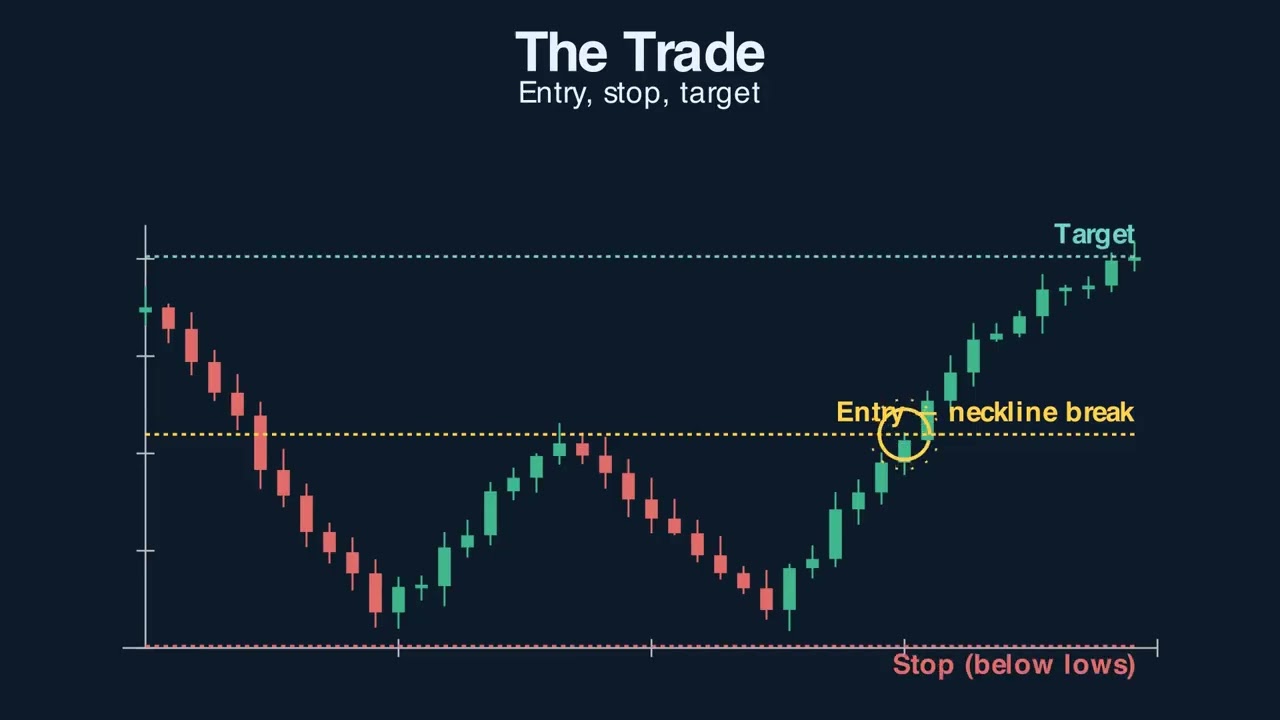
The double bottom reversal: two tests of support, the neckline that confirms it, the measured-move target, and the trap of front-running the breakout. With a real chart.
The Confluence Method: a swing trade only qualifies when four signals stack — price action/structure, a key level, momentum, and a trigger — run through one workflow: Scan, Stack, Execute, Review. Shown on animated charts and a real ticker.
Indicator-Confirmed Chart Patterns: Filtering the Noise OBV is one of the most-used — and most-misused — tools in technical analysis. In this episode we break it down for serious traders: the intuition and the math, how to read it, real entry and exit signals, an analogy that makes it click, a worked example, and the pitfalls to avoid.
May 2026 watchlist via the Confluence Method screener: 5 S&P 500 stocks that passed all four signals — price action above a rising 50-day, breakout above the 60-day high, RSI 50-70 and rising, and a volume-confirmed trigger candle — plus 5 high-flying names every other channel will list that the method rejects (all for the same reason: RSI extended). Educational only, not financial advice.
CCI: Spotting Cyclical Extremes CCI is one of the most-used — and most-misused — tools in technical analysis. In this episode we break it down for serious traders: the intuition and the math, how to read it, real entry and exit signals, an analogy that makes it click, a worked example, and the pitfalls to avoid.
Stochastic RSI: Momentum of Momentum Stochastic RSI is one of the most-used — and most-misused — tools in technical analysis. In this episode we break it down for serious traders: the intuition and the math, how to read it, real entry and exit signals, an analogy that makes it click, a worked example, and the pitfalls to avoid.
The Stochastic Oscillator, Decoded Stochastic is one of the most-used — and most-misused — tools in technical analysis. In this episode we break it down for serious traders: the intuition and the math, how to read it, real entry and exit signals, an analogy that makes it click, a worked example, and the pitfalls to avoid.
RSI: The Overbought Trap and Divergence RSI is one of the most-used — and most-misused — tools in technical analysis. In this episode we break it down for serious traders: the intuition and the math, how to read it, real entry and exit signals, an analogy that makes it click, a worked example, and the pitfalls to avoid.
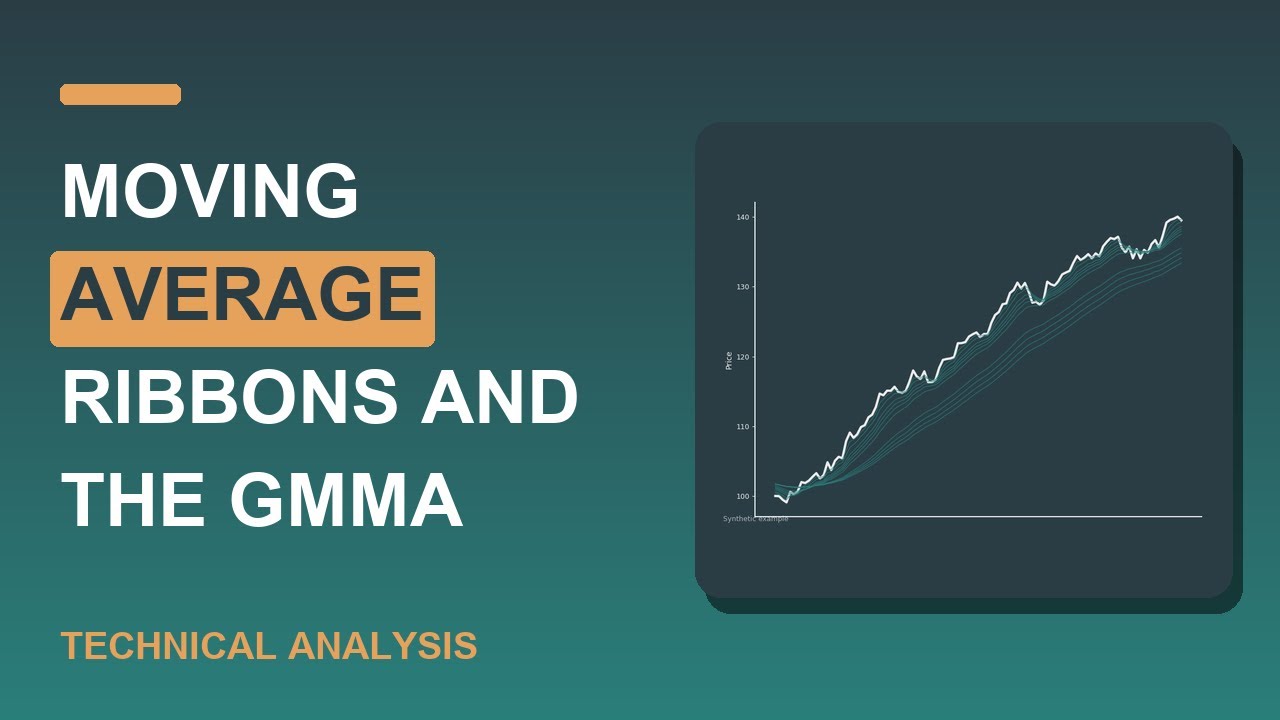
Moving Average Ribbons and the GMMA Moving Average Ribbon is one of the most-used — and most-misused — tools in technical analysis. In this episode we break it down for serious traders: the intuition and the math, how to read it, real entry and exit signals, an analogy that makes it click, a worked example, and the pitfalls to avoid.
Multi-Timeframe Analysis: Trading in Three Dimensions Moving Averages is one of the most-used — and most-misused — tools in technical analysis. In this episode we break it down for serious traders: the intuition and the math, how to read it, real entry and exit signals, an analogy that makes it click, a worked example, and the pitfalls to avoid.
Supertrend: A Cleaner Trend Filter Supertrend is one of the most-used — and most-misused — tools in technical analysis. In this episode we break it down for serious traders: the intuition and the math, how to read it, real entry and exit signals, an analogy that makes it click, a worked example, and the pitfalls to avoid.
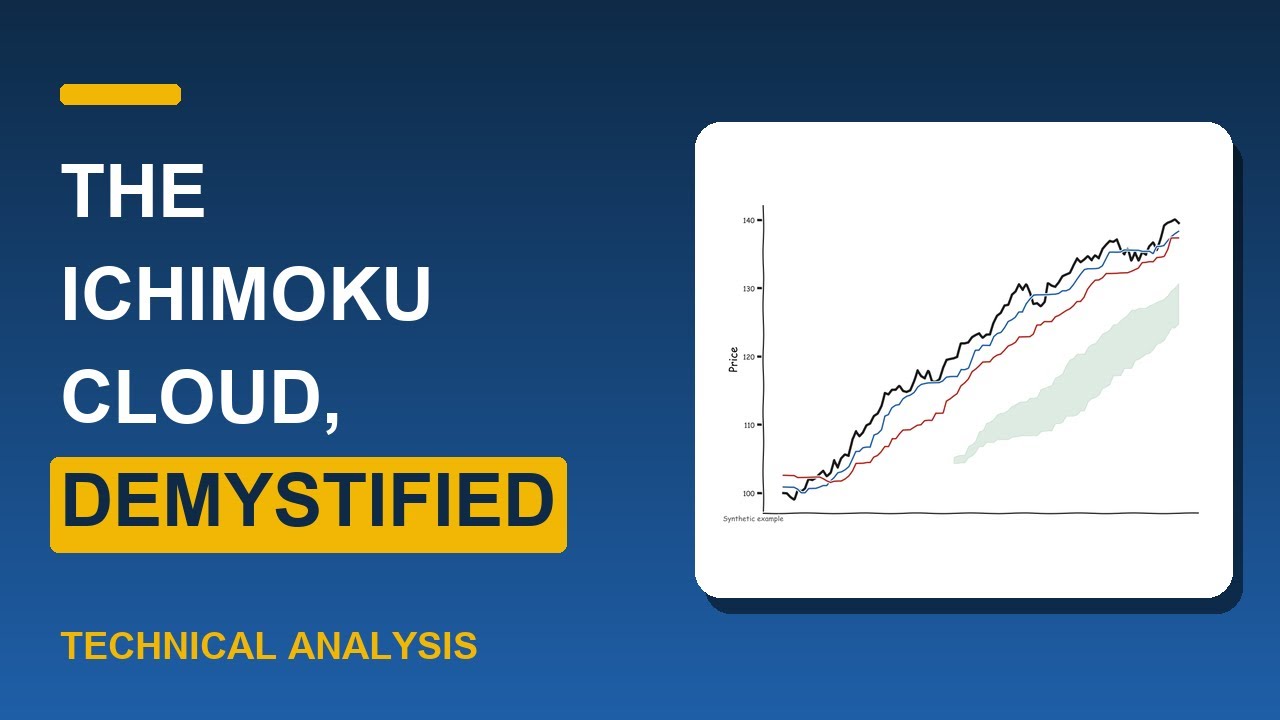
The Ichimoku Cloud, Demystified Ichimoku Cloud is one of the most-used — and most-misused — tools in technical analysis. In this episode we break it down for serious traders: the intuition and the math, how to read it, real entry and exit signals, an analogy that makes it click, a worked example, and the pitfalls to avoid.
Parabolic SAR for Trailing Stops: The Advanced Trader's Playbook Parabolic SAR is one of the most-used — and most-misused — tools in technical analysis. In this episode we break it down for serious traders: the intuition and the math, how to read it, real entry and exit signals, an analogy that makes it click, a worked example, and the pitfalls to avoid.
Master market structure the ICT way — Break of Structure (BOS) and Change of Character (CHoCH) — the foundation every futures trader needs. We break it down on a clean idealized chart, then prove it live on real S&P 500 e-mini (ES) futures.
ADX and DMI: Measuring Trend Strength ADX is one of the most-used — and most-misused — tools in technical analysis. In this episode we break it down for serious traders: the intuition and the math, how to read it, real entry and exit signals, an analogy that makes it click, a worked example, and the pitfalls to avoid.
Fibonacci Retracements and Extensions: An Advanced Trader's Guide Fibonacci is one of the most-used — and most-misused — tools in technical analysis. In this episode we break it down for serious traders: the intuition and the math, how to read it, real entry and exit signals, an analogy that makes it click, a worked example, and the pitfalls to avoid.
The Accumulation/Distribution Line: Reading the Footprints of Smart Money Accumulation/Distribution is one of the most-used — and most-misused — tools in technical analysis. In this episode we break it down for serious traders: the intuition and the math, how to read it, real entry and exit signals, an analogy that makes it click, a worked example, and the pitfalls to avoid.
The Bollinger Band Squeeze: Trading Volatility Compression Bollinger Bands is one of the most-used — and most-misused — tools in technical analysis. In this episode we break it down for serious traders: the intuition and the math, how to read it, real entry and exit signals, an analogy that makes it click, a worked example, and the pitfalls to avoid.
Donchian Channels and the Turtle Breakout Donchian Channels is one of the most-used — and most-misused — tools in technical analysis. In this episode we break it down for serious traders: the intuition and the math, how to read it, real entry and exit signals, an analogy that makes it click, a worked example, and the pitfalls to avoid.
Keltner Channels vs Bollinger Bands: The Volatility Duel Bollinger Bands is one of the most-used — and most-misused — tools in technical analysis. In this episode we break it down for serious traders: the intuition and the math, how to read it, real entry and exit signals, an analogy that makes it click, a worked example, and the pitfalls to avoid.
Money Flow Index: The Volume-Weighted RSI Money Flow Index is one of the most-used — and most-misused — tools in technical analysis. In this episode we break it down for serious traders: the intuition and the math, how to read it, real entry and exit signals, an analogy that makes it click, a worked example, and the pitfalls to avoid.
Rate of Change: Reading Pure Price Momentum Rate of Change is one of the most-used — and most-misused — tools in technical analysis. In this episode we break it down for serious traders: the intuition and the math, how to read it, real entry and exit signals, an analogy that makes it click, a worked example, and the pitfalls to avoid.
ATR and Volatility-Based Stops: The Advanced Trader's Guide ATR is one of the most-used — and most-misused — tools in technical analysis. In this episode we break it down for serious traders: the intuition and the math, how to read it, real entry and exit signals, an analogy that makes it click, a worked example, and the pitfalls to avoid.
Bollinger Bands: Mean Reversion and Trend Bollinger Bands is one of the most-used — and most-misused — tools in technical analysis. In this episode we break it down for serious traders: the intuition and the math, how to read it, real entry and exit signals, an analogy that makes it click, a worked example, and the pitfalls to avoid.
Williams %R Explained: An Advanced Trader's Guide Williams %R is one of the most-used — and most-misused — tools in technical analysis. In this episode we break it down for serious traders: the intuition and the math, how to read it, real entry and exit signals, an analogy that makes it click, a worked example, and the pitfalls to avoid.
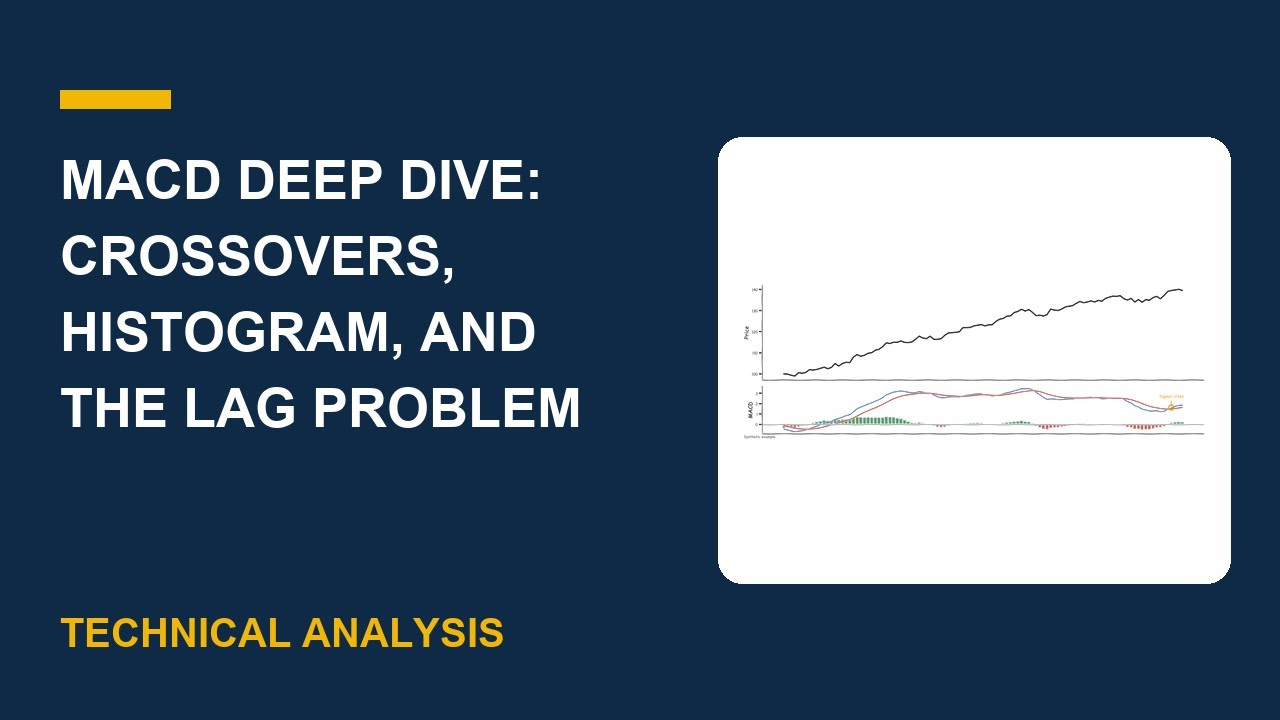
MACD Deep Dive: Crossovers, Histogram, and the Lag Problem MACD is one of the most-used — and most-misused — tools in technical analysis. In this episode we break it down for serious traders: the intuition and the math, how to read it, real entry and exit signals, an analogy that makes it click, a worked example, and the pitfalls to avoid.
Moving Averages: SMA vs EMA and the Crossover Moving Averages is one of the most-used — and most-misused — tools in technical analysis. In this episode we break it down for serious traders: the intuition and the math, how to read it, real entry and exit signals, an analogy that makes it click, a worked example, and the pitfalls to avoid.
Market Analysis | Price Action Secrets | Boost Your Trading | Cash the Future Market Analysis Secrets Mastering Stock Charts The Ultimate Guide to Market Analysis How to Read Stock Charts Like a Pro (Market Analysis Secrets) Technical Analysis 101 Decode Market Trends & Boost Your Trading Want to master technical analysis and improve your trading skills? In this video, we’ll break down the essentials of reading stock charts, understanding indicators, and spotting trends to make smarter trading decisions.
Impact of Economic Indicators on the Stock Market| Exponential Economic Indicators Stock Market 📈Cash the Future's Discover how key economic indicators like GDP, inflation, and interest rates impact stock prices. Learn how traders use these reports to predict market trends and gain an investing edge.
Essential Tools for Trading | Top 10 Essential Trading Tools for Profits in 2025 | Cash the Future Discover the ultimate trading tools for 2025! From AI-powered bots to real-time market scanners, we reveal the must-have resources for crypto and stock traders.
bitcoin crypto analysis | Bitcoin and Crypto Rise Under Trump | Cash the Future #bitcoin #crypto Discover how Donald Trump's presidency influenced Bitcoin and the crypto market. From regulatory shifts to institutional adoption, we break down key trends, market movements, and the future of digital assets.
Double RSI Trading Strategy 2025: How to Win Without Losses in Forex, Stocks & Crypto 📈 Looking for a high-accuracy trading strategy that minimizes losses and maximizes wins? The Double RSI strategy is one of the most effective ways to filter out false signals, confirm strong trends, and improve trade execution.
How to Identify Breakout Stocks Before They Explode: EVERYTHING YOU NEED TO KNOW | Pro Tips for 2025 Want to identify breakout stocks before they soar? This video is your ultimate guide to mastering the art of spotting breakout opportunities in the stock market.
5 Rules to Master Trading Psychology | How I Fixed My Day Trading Mindset (Trading Secrets Revealed) Struggling with day trading losses? You're not alone!
Follow along a day in the life of a prop trader, making money through futures, stocks, and options trading in the market. See what it takes to succeed in the world of prop trading!
Learn the basics of futures contracts in this comprehensive guide! This video breaks down what futures contracts are, how they work, and why they play a critical role in trading and investing.
Introduction to Prop Trading: What is prop trading and how does it work? In this video, we dive into the world of proprietary trading, commonly known as prop trading.
Balanced Price Range — Where two FVGs overlap. When price drops and leaves a sell-side fair value gap, then rallies back and leaves a buy-side gap, the two overlap.
Liquidity Voids — Thin areas get filled. When price delivers in one direction fast, it leaves a void: a stretch where almost no two-sided trading happened.
Indicator-Confirmed Chart Patterns. Fast trading lessons in under 30 seconds — indicators, ICT smart-money concepts, and real setups for stocks and futures.
The descending triangle: flat support, lower highs, and the breakdown that follows — the bearish mirror of the ascending triangle. Anatomy, entry/stop/target, the early-entry trap, and a real chart.
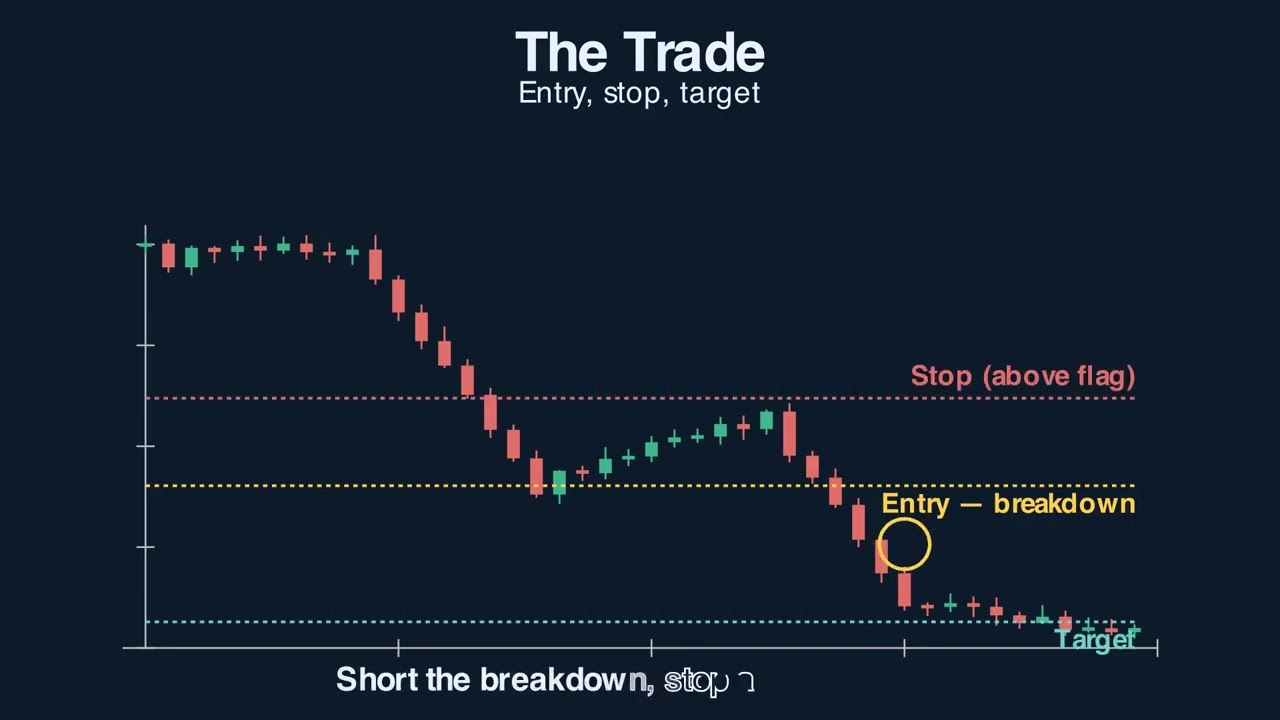
The bear flag: a sharp drop, a weak upward drift, then continuation lower. The mirror of the bull flag — anatomy, the breakdown trigger, entry/stop/target, and the short-squeeze trap.
Welcome to Stock Market Method. We teach the Confluence Method — the four-signal framework that filters 90 percent of bad trades out: price action, a key level, momentum, and a trigger that has to fire before you commit a cent.
Deepseek | How to Use DeepSeek | NEW Deepseek AI Good For Creating Trading Strategies Hidden Risks Is AI Manipulating the Stock Market? The Hidden Risks of AI Trading AI in Trading: Hidden Dangers You MUST Know Before Investing DeepSeek AI & Stock Market Manipulation – Should Investors Be Worried AI-powered trading is transforming the stock market, but is it also creating hidden risks?
The Biggest 10 Trading Mistakes You're Probably Making in 2025 | How to Avoid TRADING MISTAKES Discover the **Top 10 Trading Mistakes** that could be costing you money and learn how to avoid them! In this insightful video, we break down common pitfalls such as entering trades too late, misusing indicators, and neglecting stop losses.
How to Read a Candlestick Chart #stockmarket #finance #candlestick #chart Special Discount Coupon for Prop Trading Firm https://apextraderfunding. com/member/aff/go/jdmtventuresllc?
Get ready for a BIG change in your DTI score! 🚀 Stay tuned for all the details and upcoming updates that could majorly impact your financial journey!
Price Action — FAQ
Why start with price action instead of indicators?+
Indicators are derived from price, so they lag it. Reading structure first — trend direction and swing points — tells you the context an indicator can only echo, and keeps you trading with the dominant flow rather than against it.
What structures does the method trade?+
Primarily continuation setups (pullbacks and bases inside a trend) and high-confidence reversals at exhausted swings. Each must still stack a level, momentum, and a trigger before it qualifies.
One concise email when a new lesson drops — plus the occasional breakdown you won't find on YouTube. No spam, unsubscribe anytime.
We use privacy-friendly analytics (Google Analytics & Microsoft Clarity)
to understand what's useful and improve the lessons. No cookies or tracking
are set until you accept. See our
privacy notice.
 4:52
4:52