Gold Traded at 11x Normal Volume Today — What That Signal Means
TL;DR
Robinhood surged 9%, gold traded at 11x normal volume, and sectors rotated hard. Here is what the technical signals flagged on a rough Wednesday close.
“Robinhood surged 9%, gold traded at 11x normal volume, and sectors rotated hard. Here is what the technical signals flagged on a rough Wednesday close.”
This lesson lives in the Stack step of the Confluence Method, where you confirm momentum, price action and structure and a trigger before a setup qualifies as a trade.
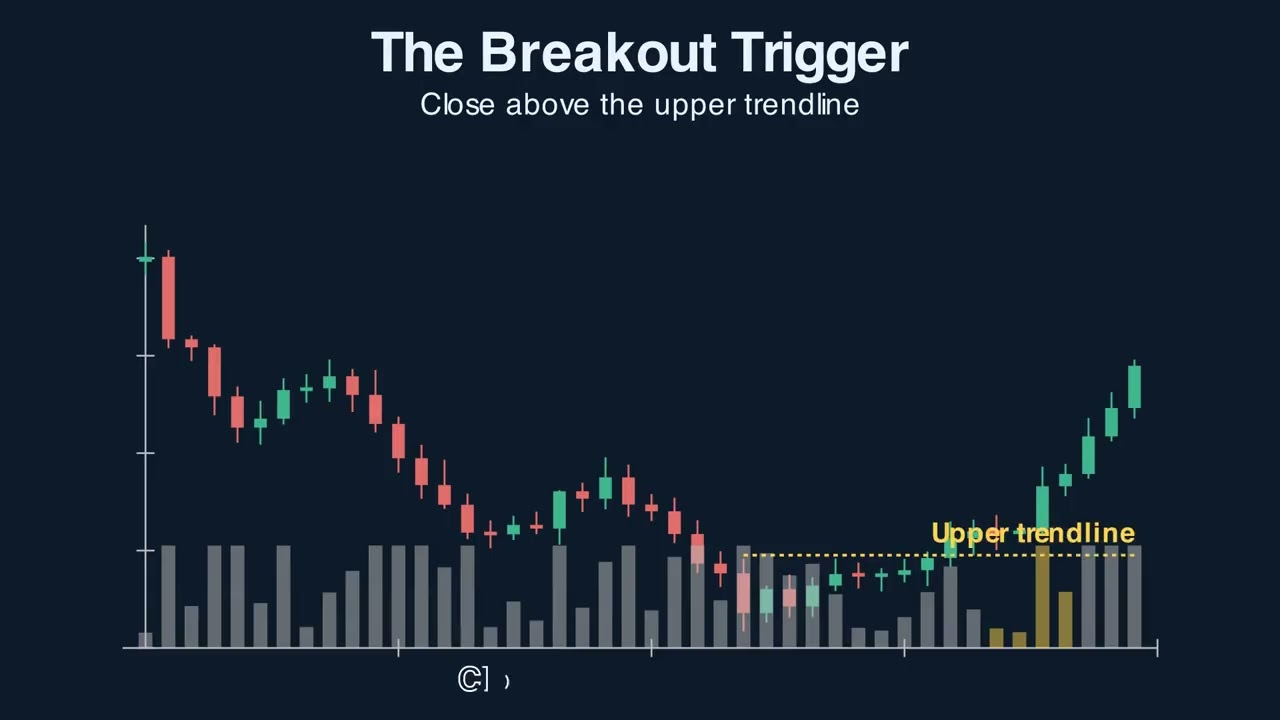
A pullback that looks bearish but is actually bullish: converging trendlines, drying volume, then the breakout that launches the next leg. The falling-wedge anatomy, the volume tell, the trigger, and the trap of trading it before the break.
The bull pennant is the bull flag's faster, tighter cousin — sharper pole, narrower pause, more violent breakout. We break down the anatomy, the volume signature, how to tell it apart from a flag, and the trap of trading wide pennants.
Building Indicator Confluence: Stacking Edge Without Stacking Noise Moving Averages is one of the most-used — and most-misused — tools in technical analysis. In this episode we break it down for serious traders: the intuition and the math, how to read it, real entry and exit signals, an analogy that makes it click, a worked example, and the pitfalls to avoid.
We use privacy-friendly analytics (Google Analytics & Microsoft Clarity)
to understand what's useful and improve the lessons. No cookies or tracking
are set until you accept. See our
privacy notice.