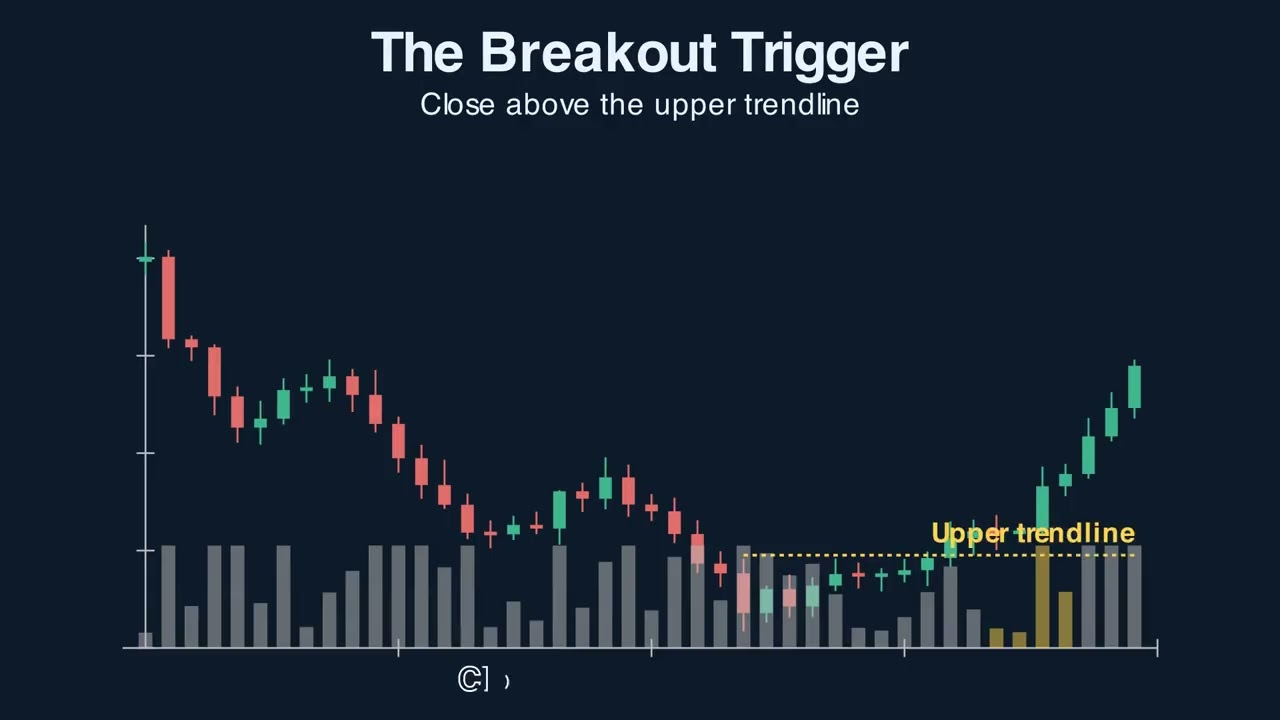
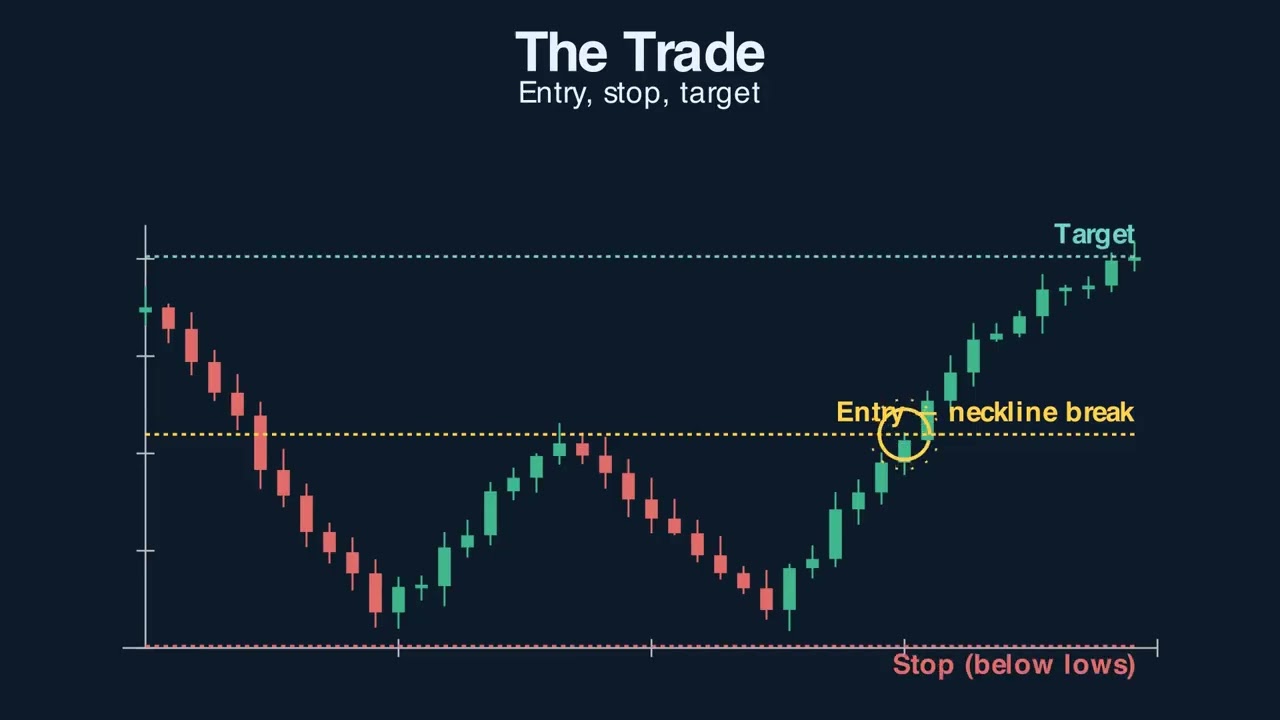
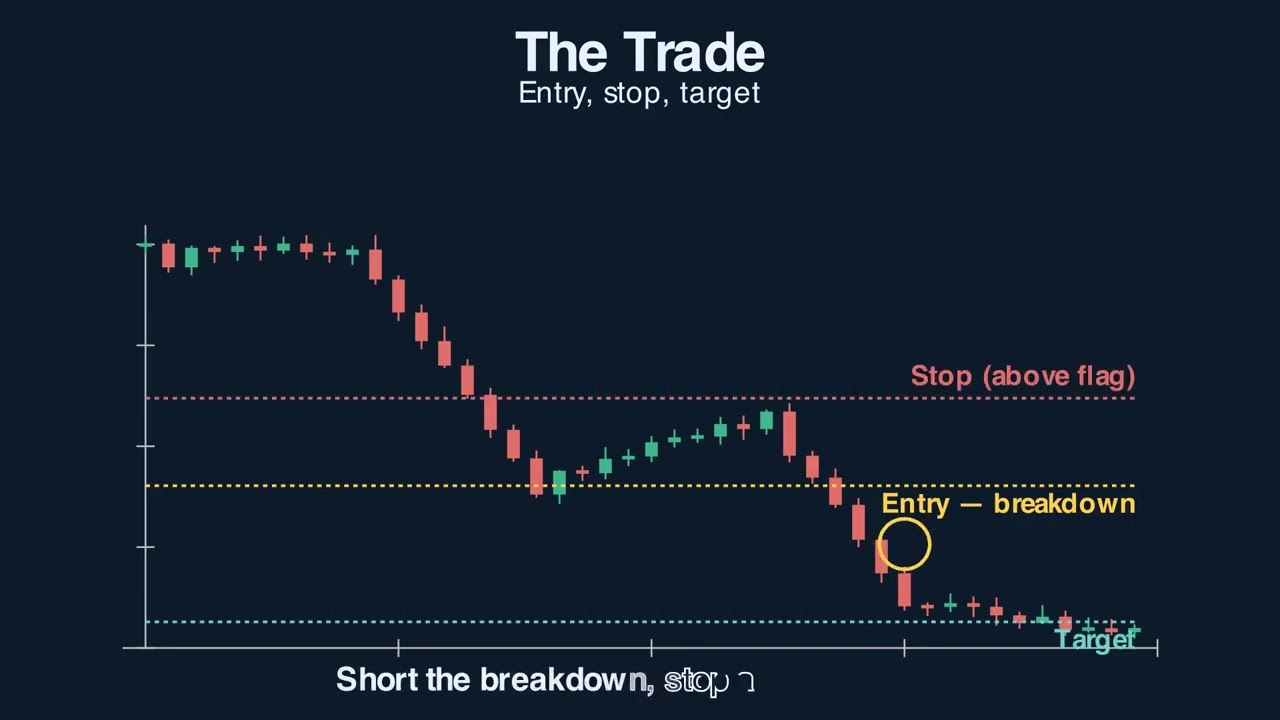
The trigger is the specific candle or event that says 'now' — it turns a watchlist setup into a live entry with a defined stop.
A trigger is the precise entry signal that fires once the other three signals are already aligned. It might be a reclaim of a level, a break of a micro consolidation, an engulfing candle, or an inside-bar breakout. The trigger exists to time the entry and define the stop so that risk is known before you click. No trigger, no trade — even when the setup looks perfect.
Rotation out of tech and into energy and defensives, gold seeing unusual volume, and Lucid getting crushed. Here is what the pre-market signals are flagging this morning.
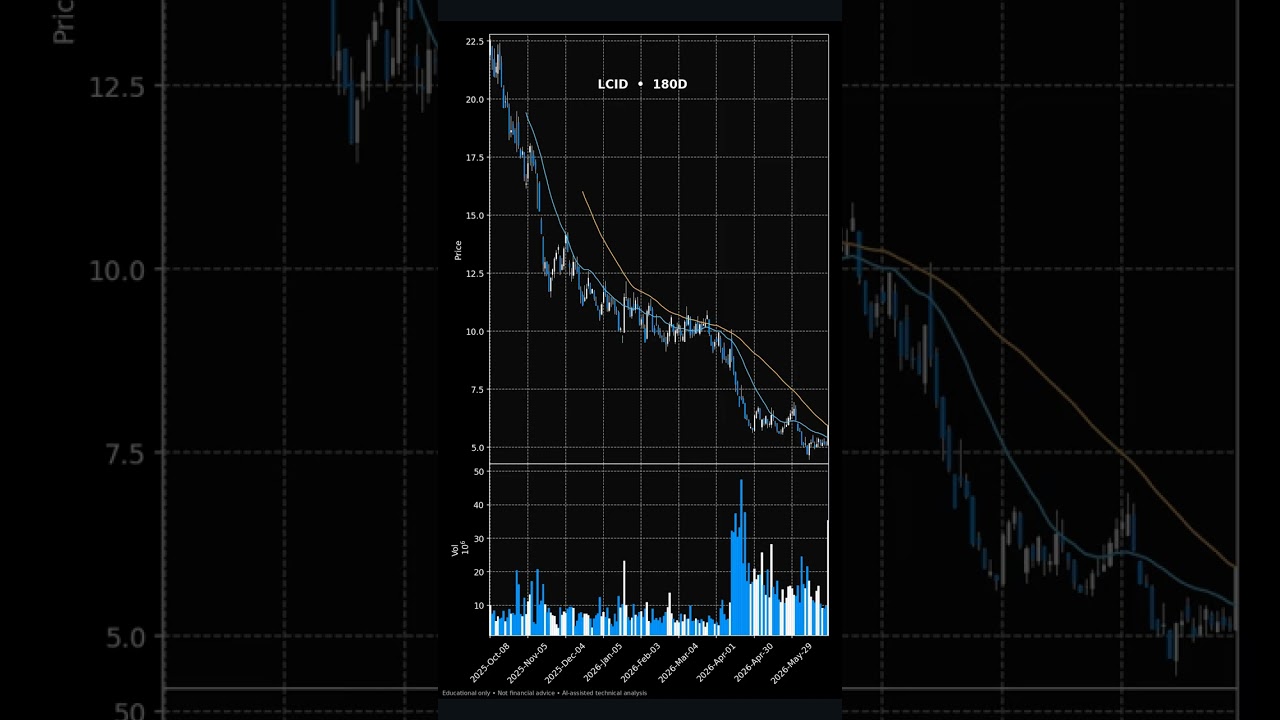
Markets told two very different stories on July 14 — gold surged on massive volume, Lucid cratered, and the rotation out of defensives into tech has technical analysts paying close attention. Tuesday, July 14 was a session of sharp contrasts — Lucid cratered while CrowdStrike surged, and Citigroup reminded Wall Street that earnings season can cut both ways.
Rotation day on Wall Street — tech surged, health care slid, gold spiked on massive volume, and a few big names had very different stories to tell. Tuesday was a tale of two markets — Lucid cratered while CrowdStrike surged, and Citigroup reminded Wall Street that even big banks can have rough days.
Most trading journals only log clearly closed trades — the rest get lost, forgotten, or rationalized away. We break down the survivorship bias hidden in incomplete journals, the entries that matter MOST (skipped setups, discretionary overrides, near-misses), and the journal format that produces actionable insights instead of selective memory.
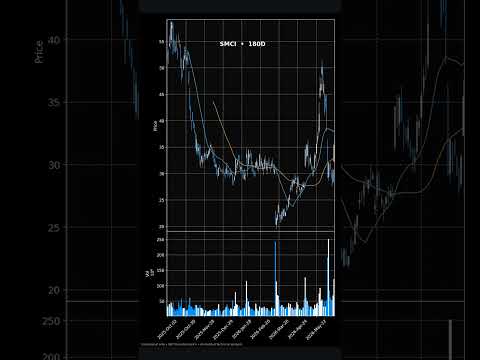
Costco under pressure, Apple and Arm flashing strength — here is what the technicals and automated signals are showing ahead of Friday's open. Good morning and happy Friday — heading into today's session, Costco Wholesale is under pressure after a sharp drop, while Apple and Arm Holdings are flashing strength that has traders paying close attention.
Once you have a thesis, your brain searches for evidence that supports it and ignores evidence that contradicts it. We break down confirmation bias in trading, the disconfirming-evidence rule that fixes it, and the pre-mortem exercise pros use to stay objective.
Most day traders watch one chart and miss the bigger context. Market internals — NYSE TICK, advance-decline, sector breadth — tell you whether the whole market is supporting your trade or fighting it.
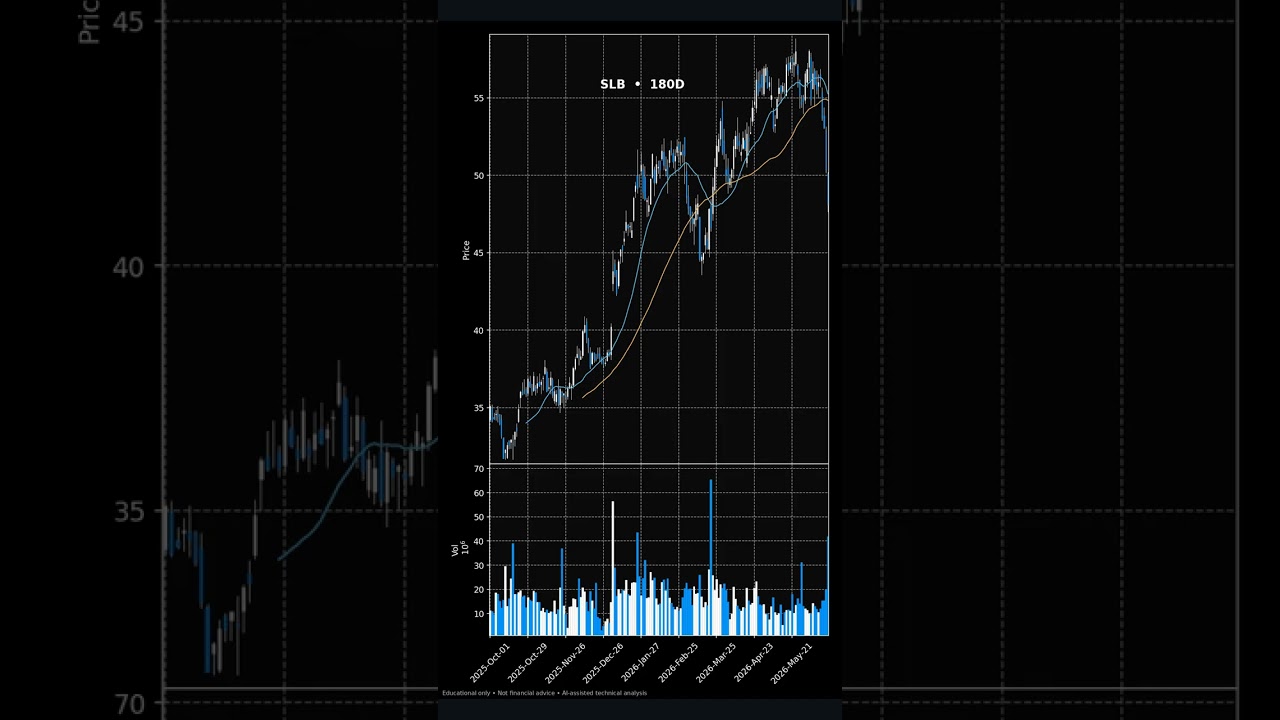
Energy ripped nearly 3% while Tech dropped over 2% in the same session. That kind of sector gap is exactly what technical traders flag as a potential risk appetite shift.
Breakout entries that work: the close-not-the-wick rule, volume confirmation, the false-breakout trap, and the retest entry. The TRIGGER signal of the Confluence Method.
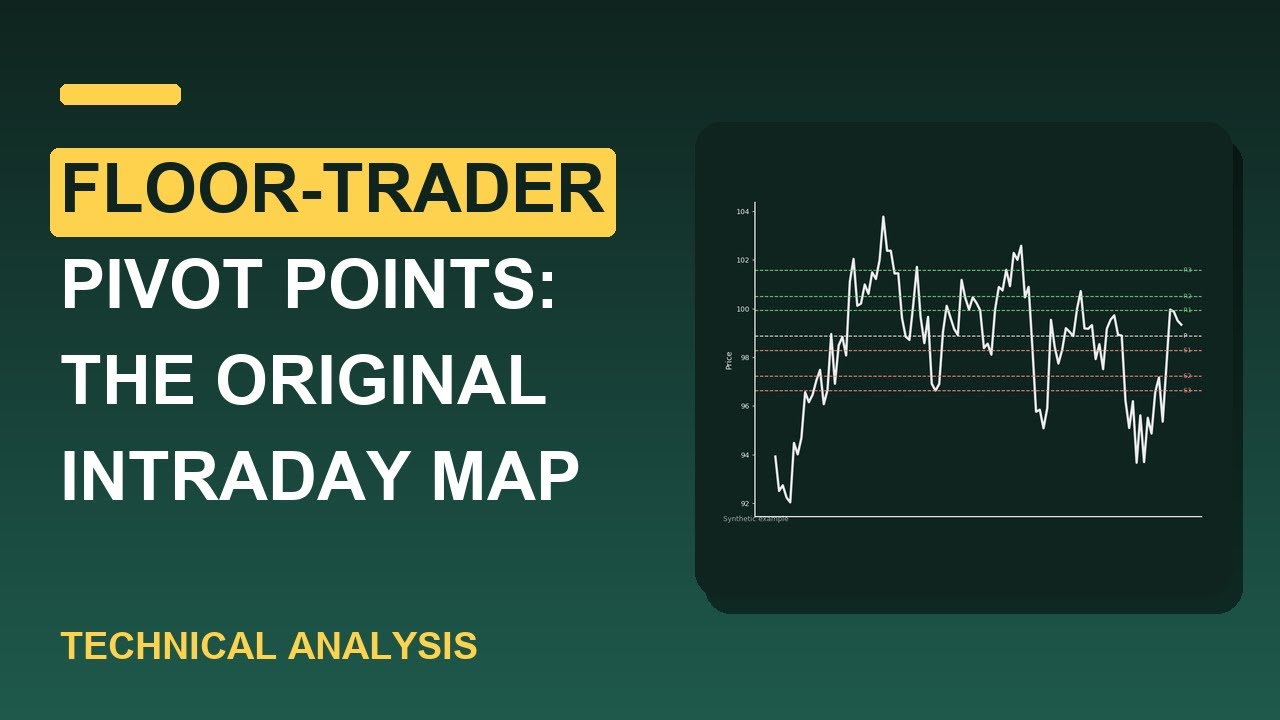
Floor-Trader Pivot Points: The Original Intraday Map Pivot Points is one of the most-used — and most-misused — tools in technical analysis. In this episode we break it down for serious traders: the intuition and the math, how to read it, real entry and exit signals, an analogy that makes it click, a worked example, and the pitfalls to avoid.
Most traders pick profit targets at random — round numbers, fixed dollar amounts, or arbitrary multiples of risk. We break down the measured-move framework, the structural levels that determine REAL exit zones, and why exit math matters as much as entry math.
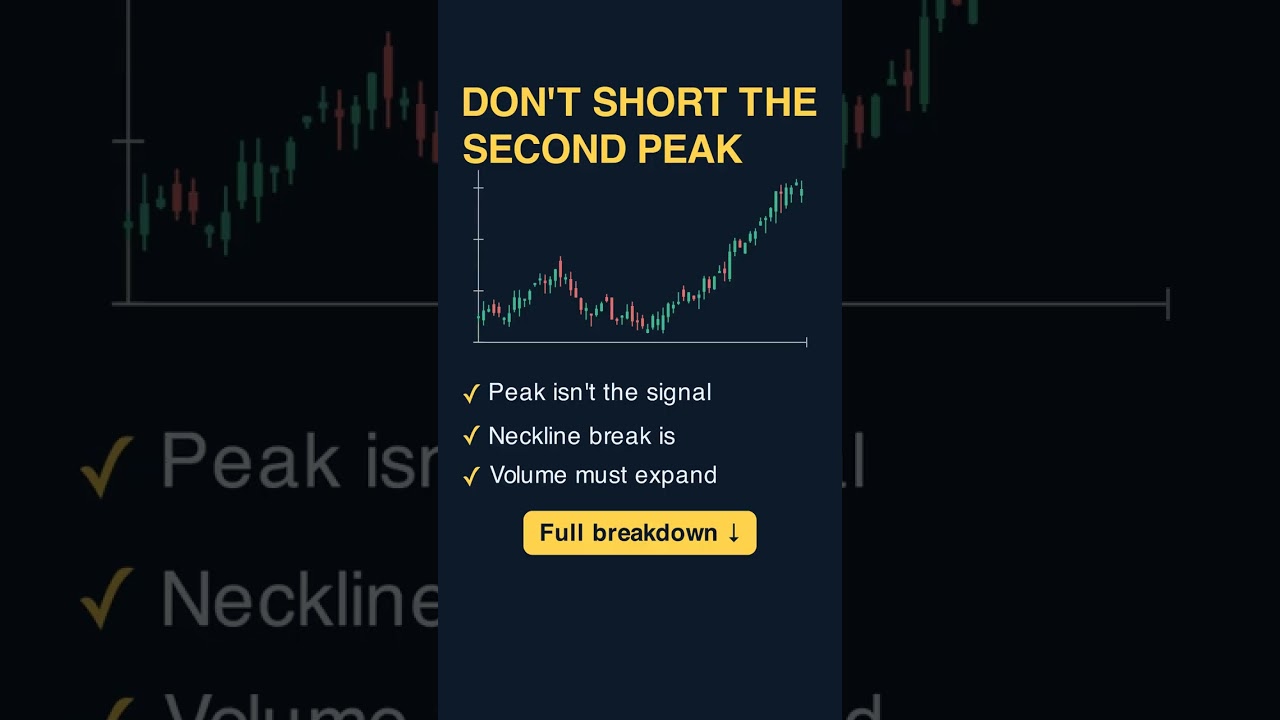
Head and shoulders is the most famous reversal pattern — and the most misidentified. We break down the structural rules that separate real H&S from lookalikes, the volume profile that confirms the pattern, and the neckline-break filter that turns a textbook pattern into an actual trade.
Chaikin Money Flow: Reading Volume Conviction Chaikin Money Flow is one of the most-used — and most-misused — tools in technical analysis. In this episode we break it down for serious traders: the intuition and the math, how to read it, real entry and exit signals, an analogy that makes it click, a worked example, and the pitfalls to avoid.
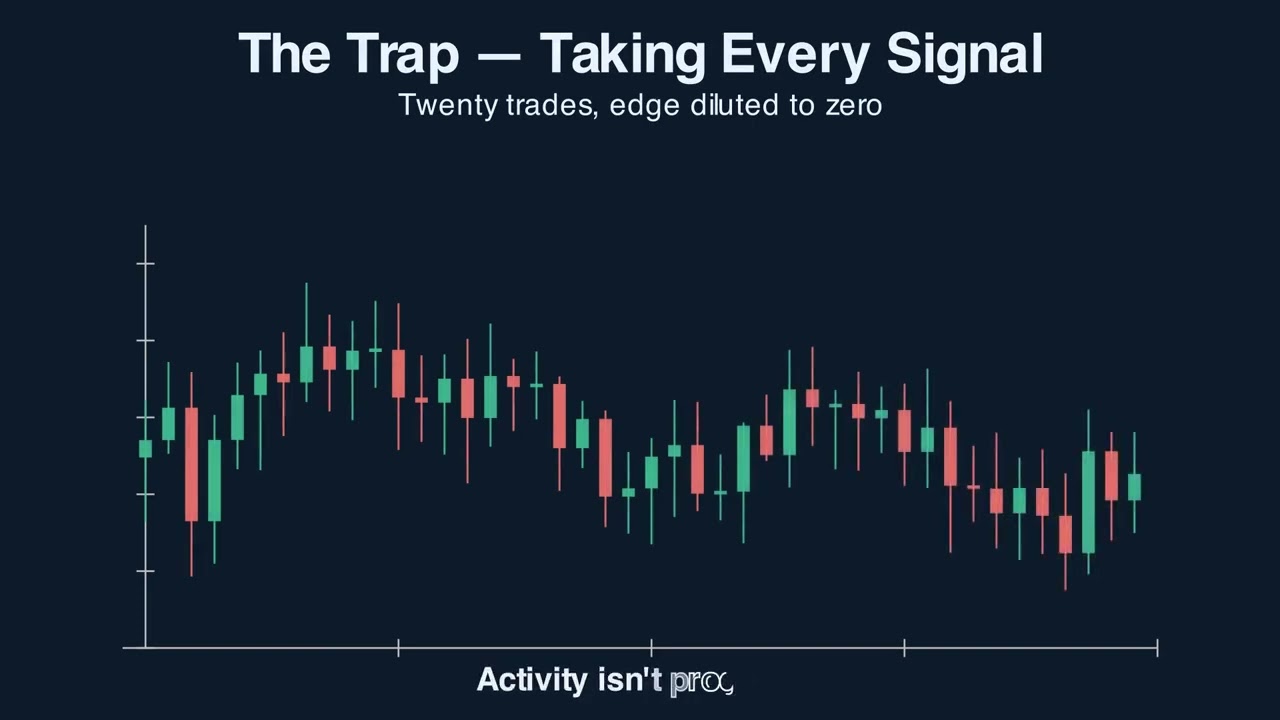
Most day traders trade too many setups, dilute their edge, and lose to transaction costs. We break down the frequency-vs-quality tradeoff, why two great trades per day beats twenty mediocre ones, and the A-setup filter that cuts trade frequency and raises expectancy at the same time.
Bollinger Bands done right: volatility envelopes, mean reversion in a range, the band-ride trap in a trend, and the squeeze that precedes the big move. Educational only, not financial advice.
Most triangle breakouts fail because the breakout direction was guessed, not confirmed. We break down the volume rule that distinguishes real breakouts from false ones, the location filter that puts triangles in the right context, and the retest entry that improves the win rate dramatically.
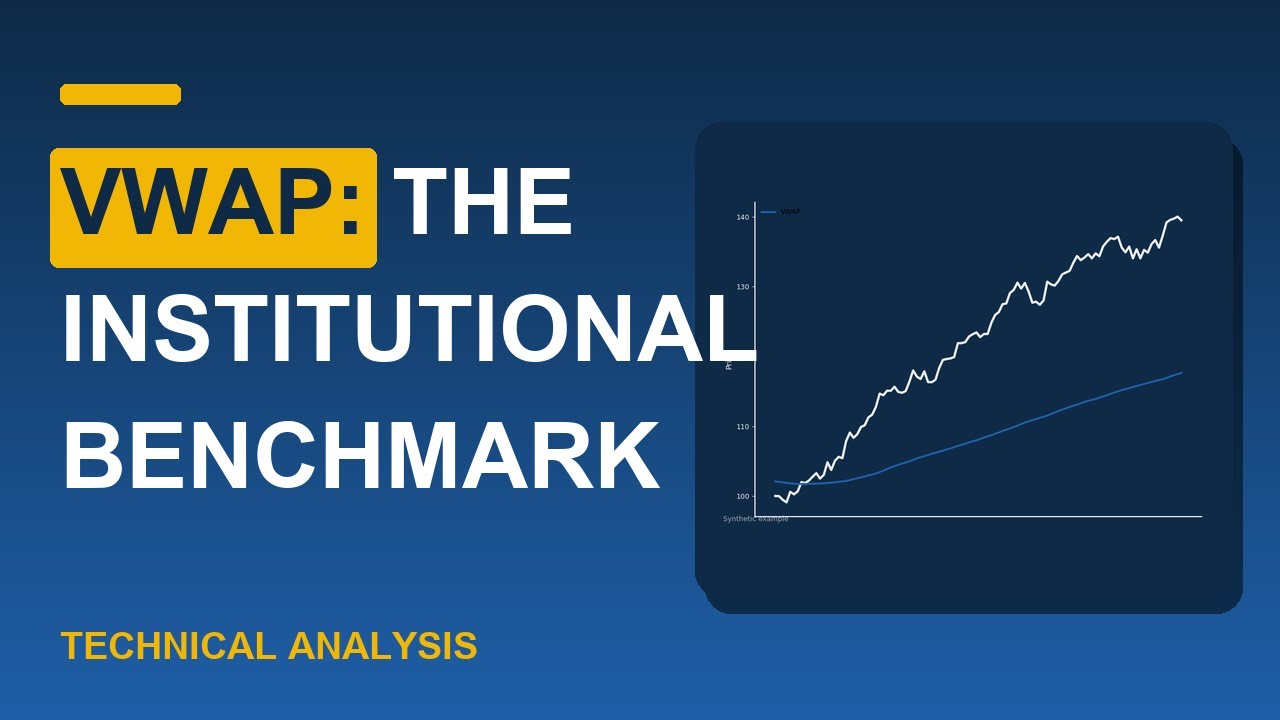
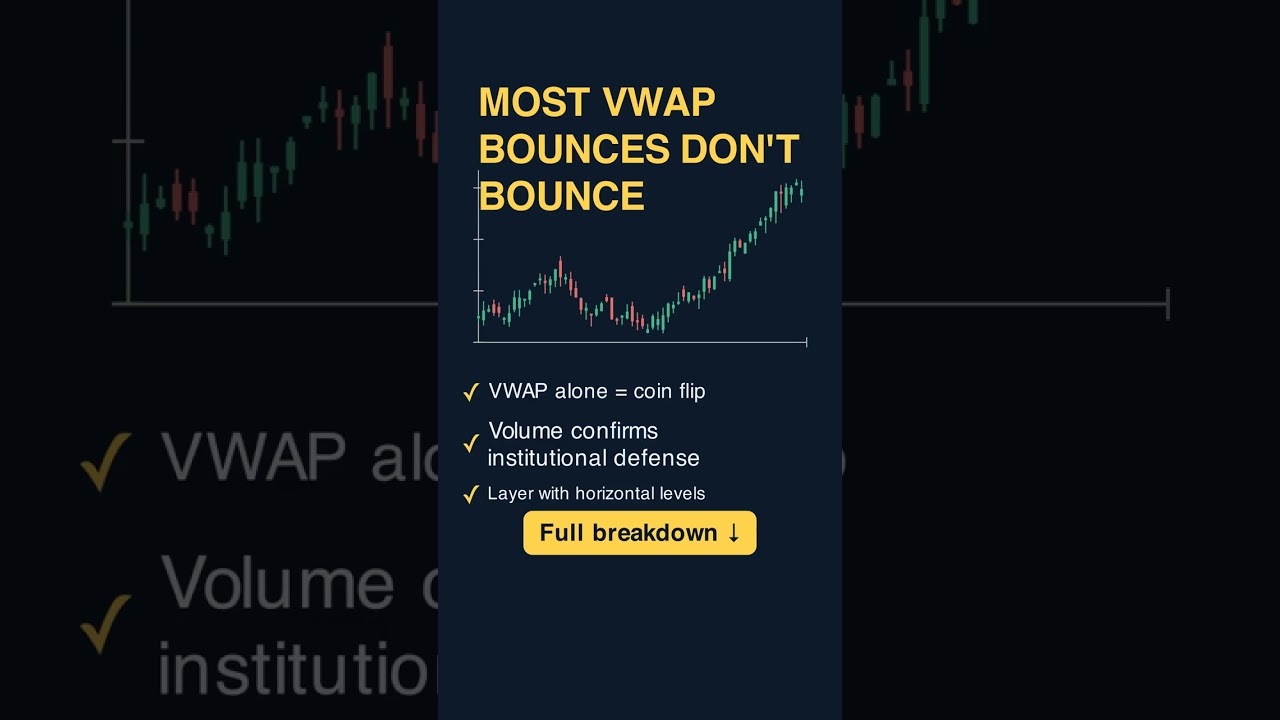
VWAP: The Institutional Benchmark VWAP is one of the most-used — and most-misused — tools in technical analysis. In this episode we break it down for serious traders: the intuition and the math, how to read it, real entry and exit signals, an analogy that makes it click, a worked example, and the pitfalls to avoid.
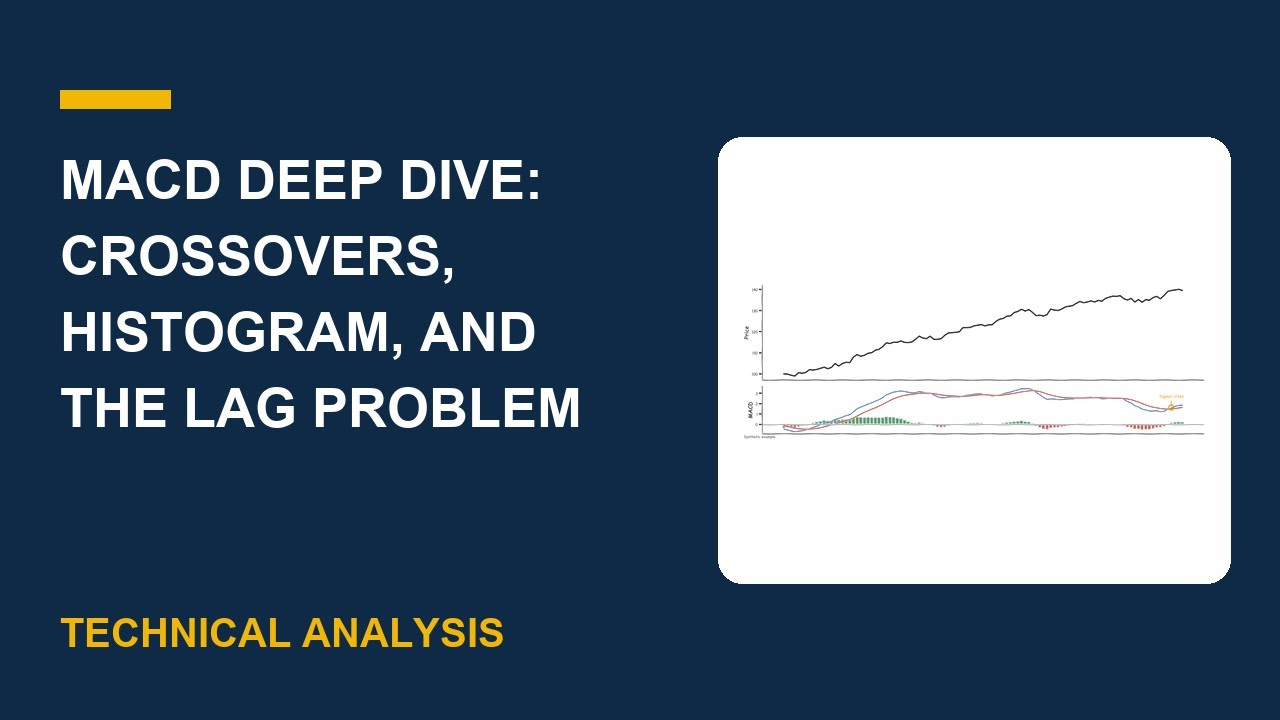
MACD beyond the crossover: the two EMAs, why the histogram leads the signal-line cross, divergence, and why it whipsaws in a range. The momentum signal of the Confluence Method.
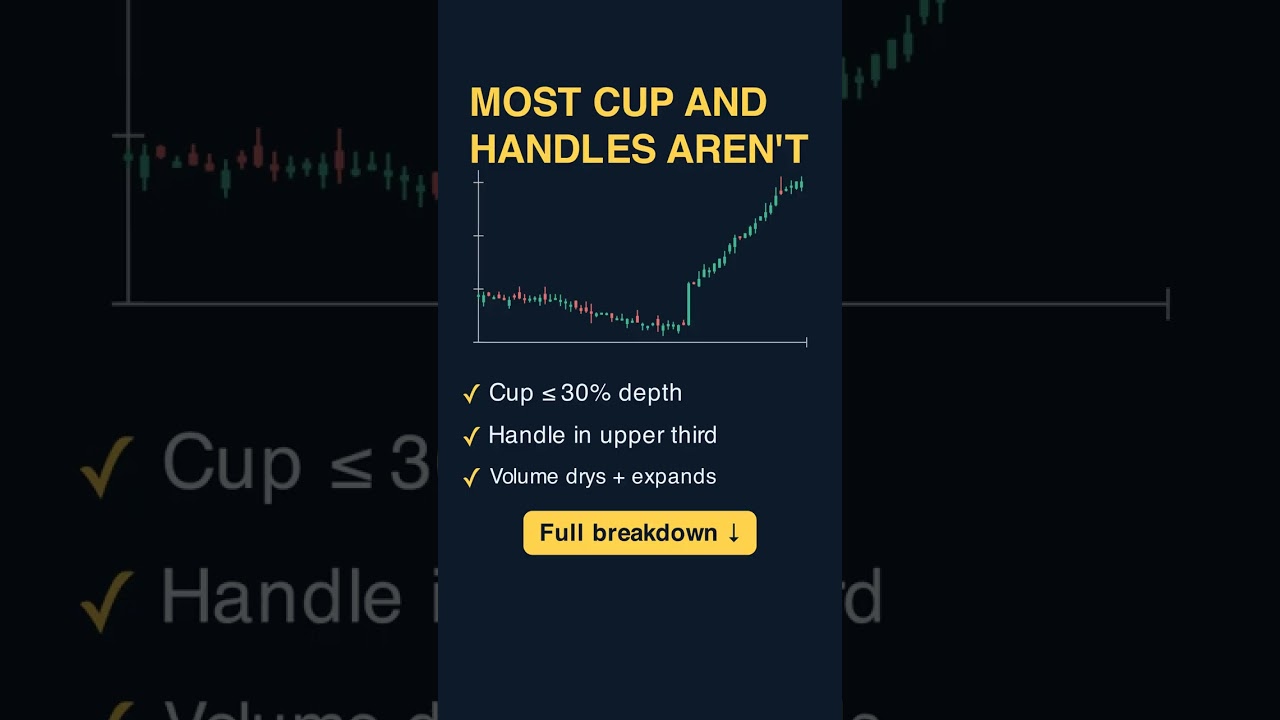
Most cup-and-handle 'patterns' are bad cup-and-handles — base too deep, handle too sloppy, volume profile wrong. We break down what makes a textbook cup and handle, the structural rules that separate real bases from sloppy ones, and the volume confirmation that turns the pattern into a trade.
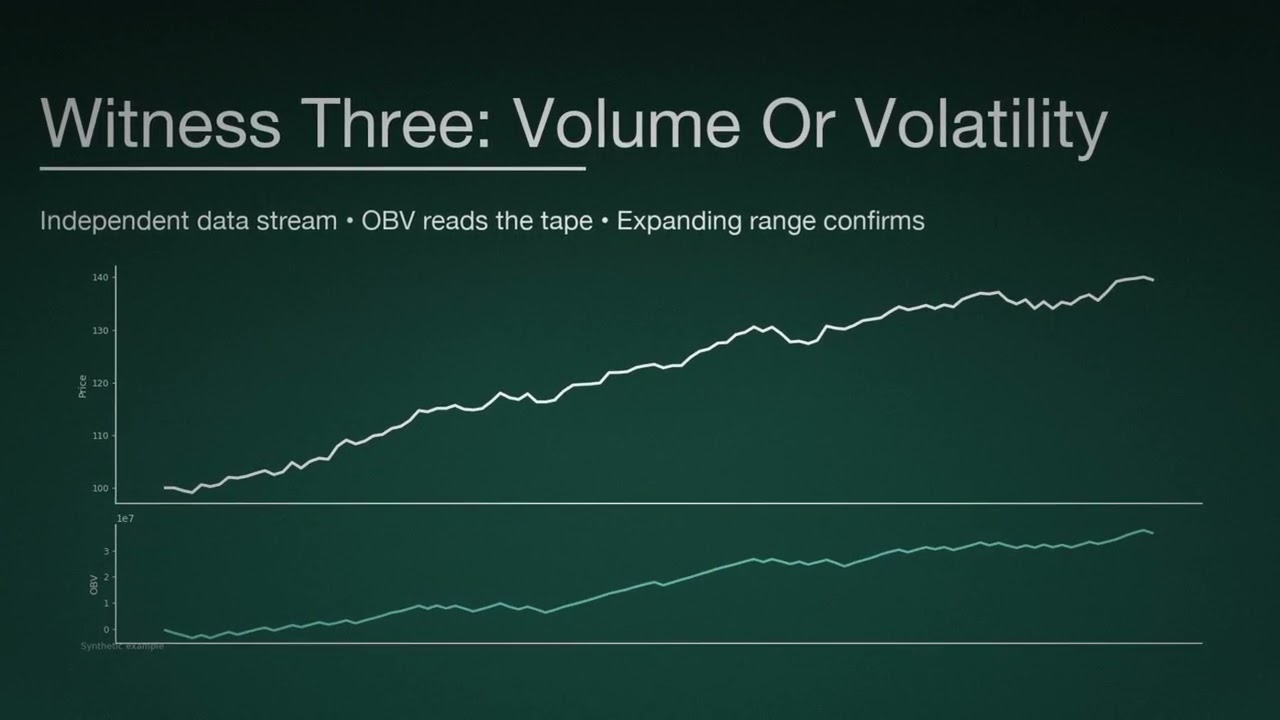
Reading Volume Spikes for Confirmation OBV is one of the most-used — and most-misused — tools in technical analysis. In this episode we break it down for serious traders: the intuition and the math, how to read it, real entry and exit signals, an analogy that makes it click, a worked example, and the pitfalls to avoid.
Most beginners short every Bollinger Band touch on the upper band and buy every touch on the lower band — and lose money. We break down the difference between mean-reversion regimes and walking-the-band trend regimes, the squeeze setup that actually has an edge, and how to combine Bollinger Bands with regime filters that work.
The mirror of the classic top: a downtrend prints three lows, the middle deepest, then breaks the neckline to launch a new uptrend. Anatomy, the one trigger that matters, the measured-move target, and the trap of buying too early.
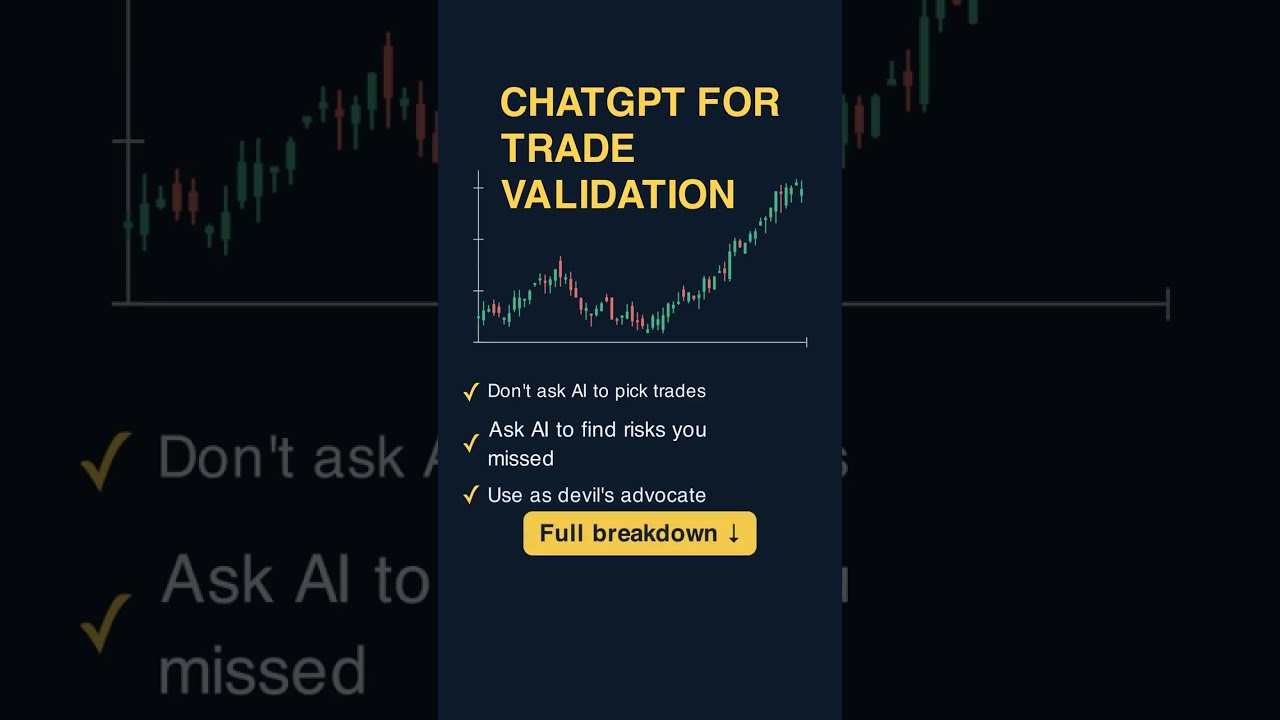
Step-by-step tutorial on using ChatGPT to sanity-check trade ideas BEFORE entry: stress-testing your thesis, surfacing risks you missed, and challenging confirmation bias. Use AI as your skeptical co-pilot, not as a signal generator.
A pullback that looks bearish but is actually bullish: converging trendlines, drying volume, then the breakout that launches the next leg. The falling-wedge anatomy, the volume tell, the trigger, and the trap of trading it before the break.
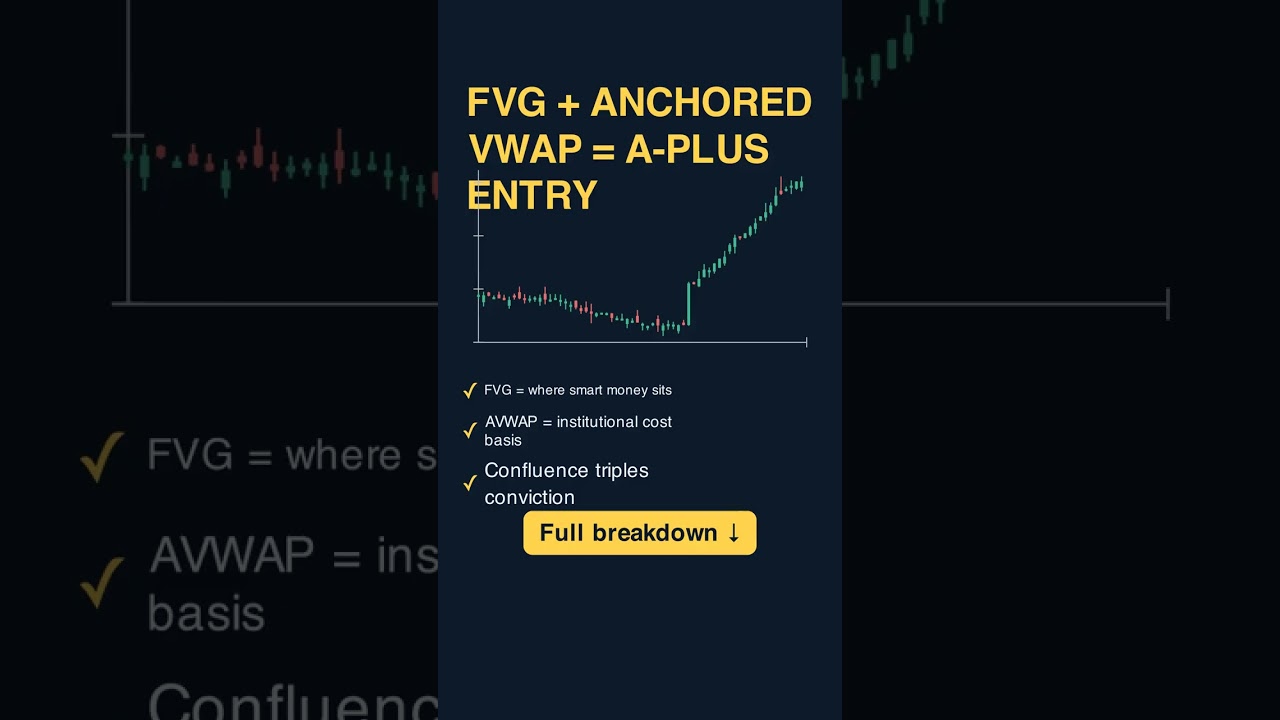
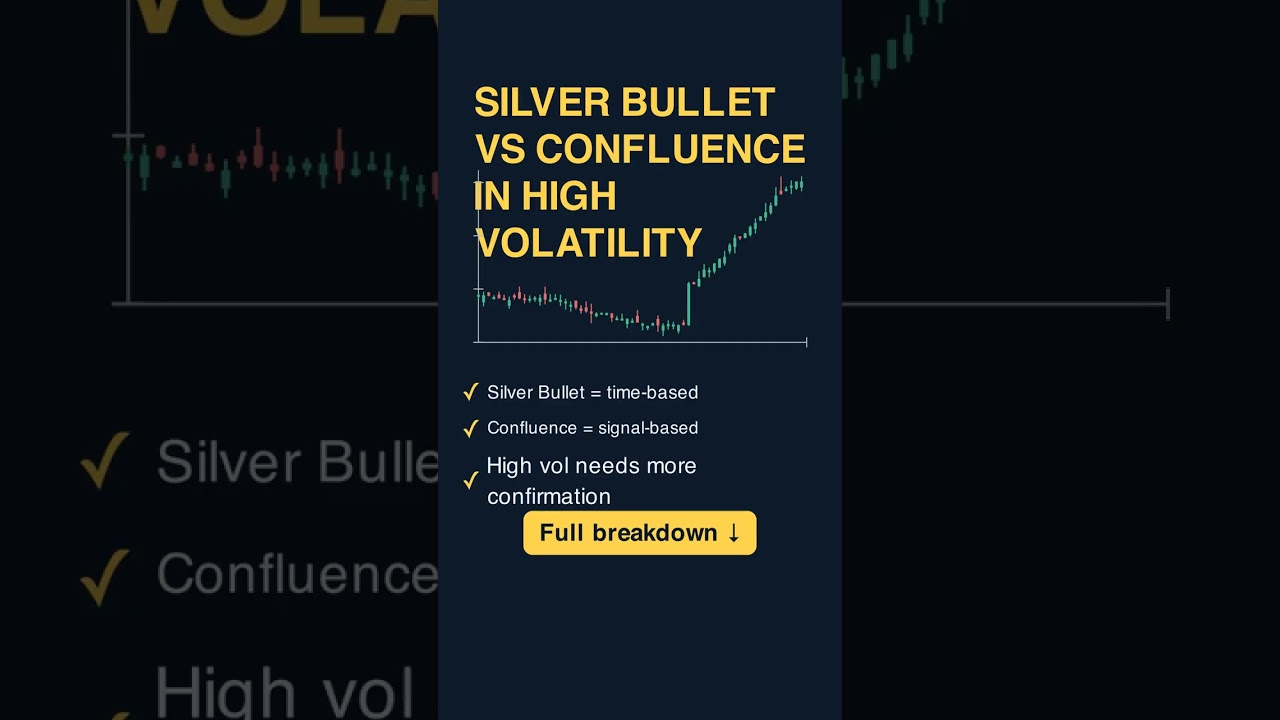
ICT Silver Bullet fires every day in the 10-11 AM New York window — but rigid time windows break down when volatility spikes. We compare the time-based Silver Bullet to the signal-based Confluence Method on a high-volatility session, showing why multi-factor confirmation (Anchored VWAP + key level + momentum + trigger) wins when single-factor liquidity sweeps lose.
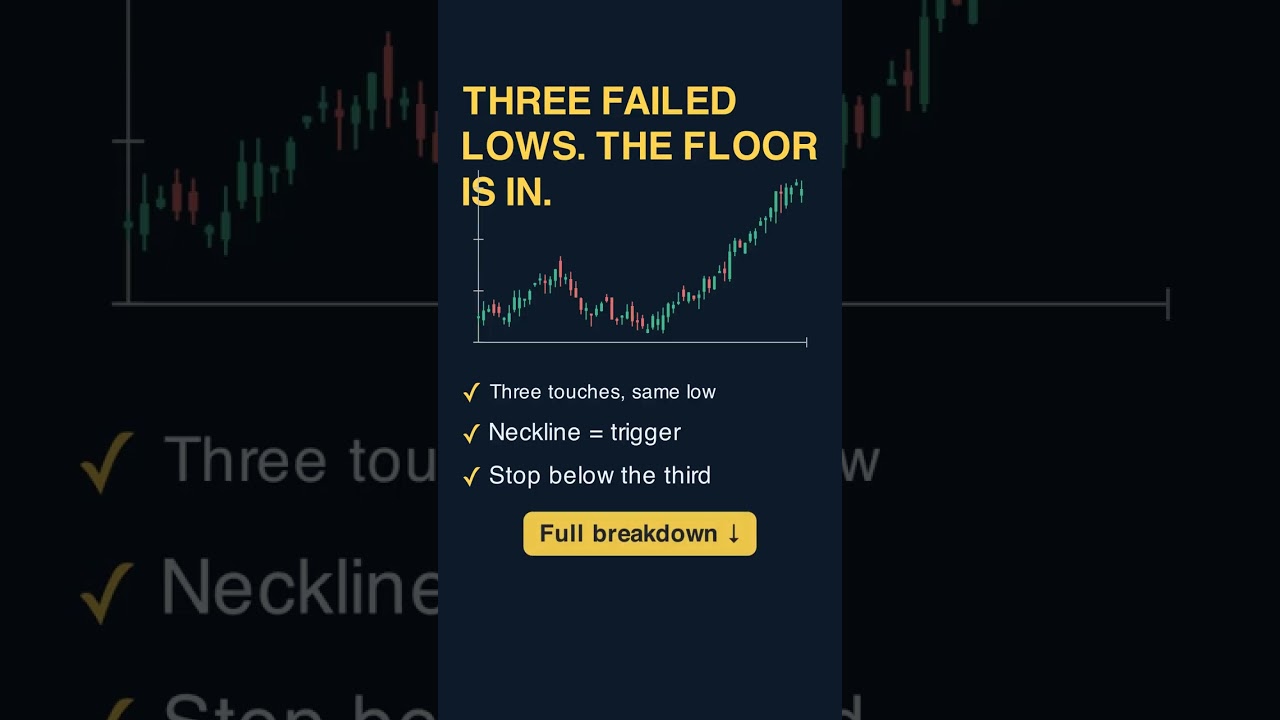
Three failed lows is the market screaming the floor is in. We break down the anatomy of a triple bottom, the volume signature that confirms it, the neckline trigger, and the trap of buying the third test instead of waiting for the breakout.
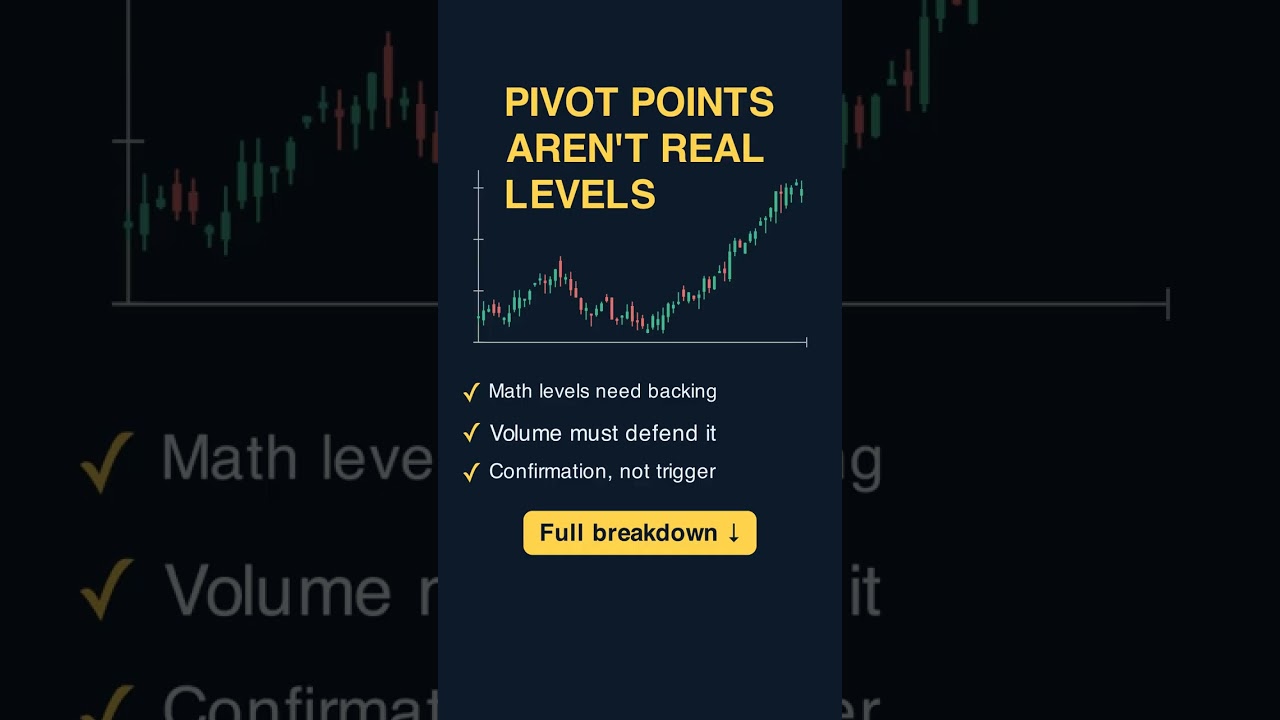
Pivot points are taught as automatic intraday support and resistance — and most fail. We break down why pivots are reference lines, not levels, the confluence filter that separates real pivot defense from random math, and how pros use pivots as confirmation rather than entry triggers.
The bull pennant is the bull flag's faster, tighter cousin — sharper pole, narrower pause, more violent breakout. We break down the anatomy, the volume signature, how to tell it apart from a flag, and the trap of trading wide pennants.
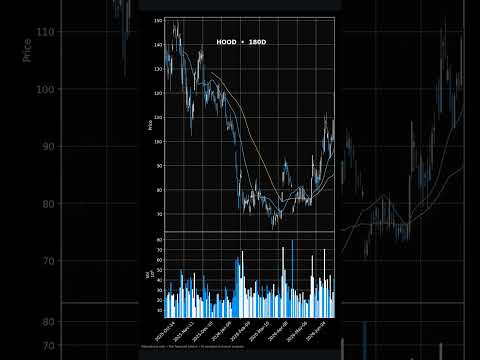
Gold dumped 2% on 7x normal volume, Robinhood is surging 9% pre-market, and sector rotation is telling a story. Here is what the technicals are showing before the open.
Robinhood surged 9%, gold traded at 11x normal volume, and sectors rotated hard. Here is what the technical signals flagged on a rough Wednesday close.
OTE deep dive: the 62-79% retracement zone where smart money fills entries, why 70. 5% is the sweet spot, and how to stack OTE with order blocks and fair value gaps for A-plus entries.
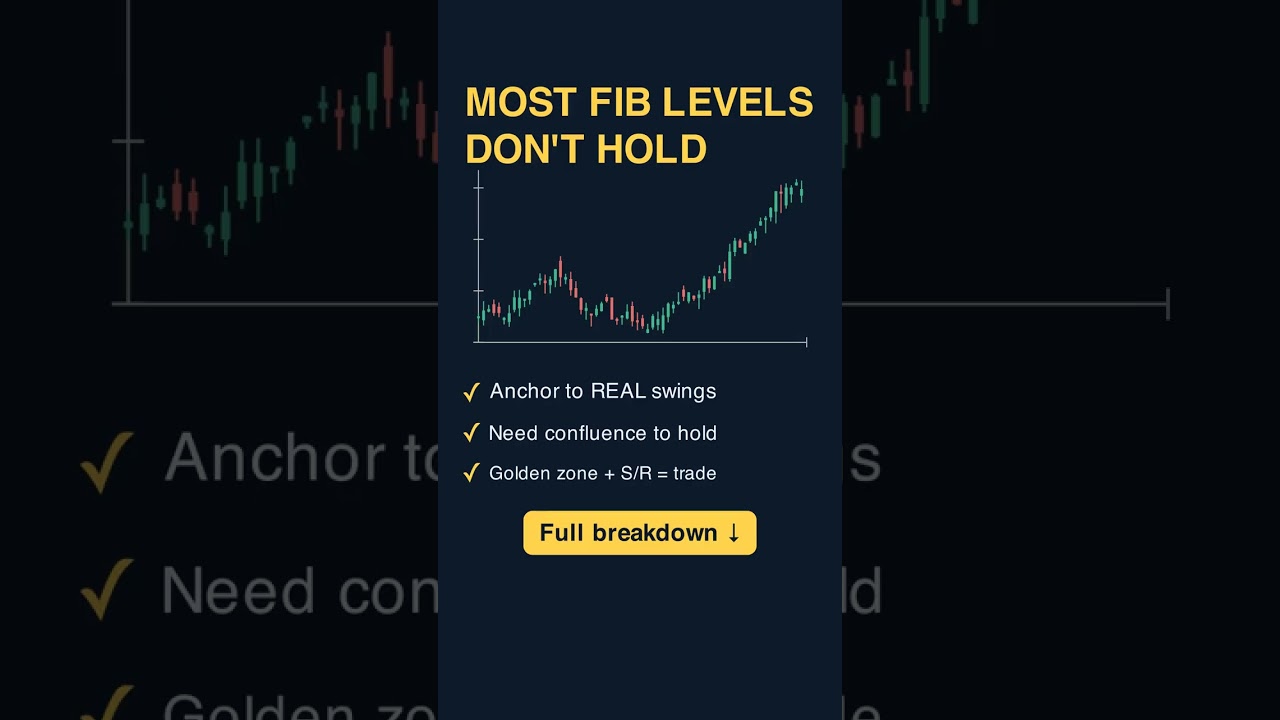
Turtle Soup is the failed-breakout reversal that punishes breakout traders. We break down the 20-day high sweep, the immediate failure, the entry and stop, and the one filter that keeps you from taking it in a trend.
Every trader repeats the 'always take 1-to-3 risk-reward' advice without doing the math. We break down why R R alone doesn't determine profitability, the expectancy formula that ACTUALLY decides whether your strategy works, and how to combine R R with realistic win-rate ranges from confluence setups.
Round numbers feel like support and resistance, but most aren't. We break down why round numbers act as magnets without acting as floors, the confluence filter that separates psychological levels from structural levels, and how to trade round numbers only when the chart actually agrees.
Building Indicator Confluence: Stacking Edge Without Stacking Noise Moving Averages is one of the most-used — and most-misused — tools in technical analysis. In this episode we break it down for serious traders: the intuition and the math, how to read it, real entry and exit signals, an analogy that makes it click, a worked example, and the pitfalls to avoid.
Gaps are the market shouting what it usually whispers — and most traders read them backwards. We break down the three gaps that matter, why the gap fill is the highest-percentage swing setup, the exhaustion gap that traps chasers, and how to use volume to tell them apart.
The bull flag, the Confluence way — pole, flag, breakout shown on animated charts, then proven on real NVDA daily price. Volume + RSI confirmation, the exact entry, the stop, and the measured-move target.
The reason your winners aren't bigger isn't entry timing — it's exit psychology. We break down why traders take profit too early, the measured-move math that gives you a real target, and the structure-based profit-taking system the pros use to let winners actually run.
Same setup, two stocks, completely different outcome — and the reason is sector relative strength. We break down the ratio chart, the leading-sector rule, and how to pick the strongest stock in the strongest sector.
The first thirty minutes set the day. We break down the opening range, the breakout trigger that catches the real move, the volume and trend filters that double the win rate, and the fake-out trap.
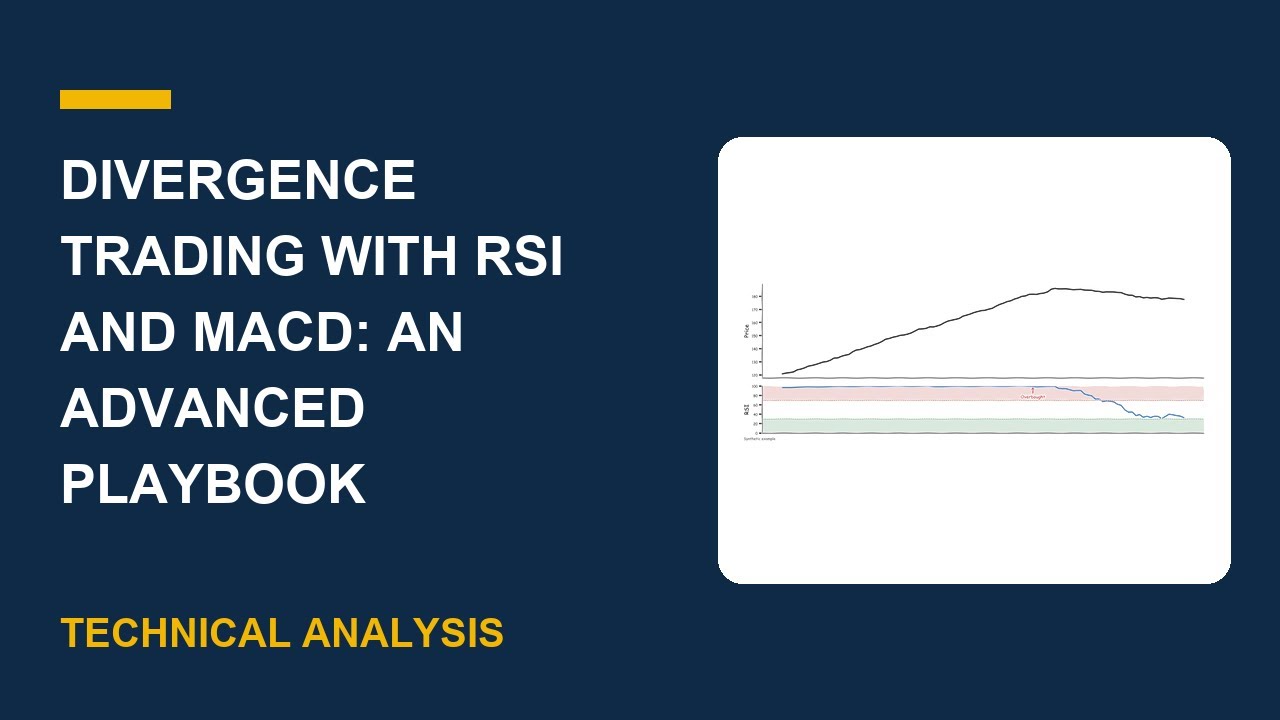
Divergence Trading with RSI and MACD: An Advanced Playbook Divergence is one of the most-used — and most-misused — tools in technical analysis. In this episode we break it down for serious traders: the intuition and the math, how to read it, real entry and exit signals, an analogy that makes it click, a worked example, and the pitfalls to avoid.
A perfect setup in an illiquid name is still a bad trade. We break down why liquidity dominates trade quality, the minimum volume threshold pros require, and how illiquid stocks turn good setups into stop-out factories.
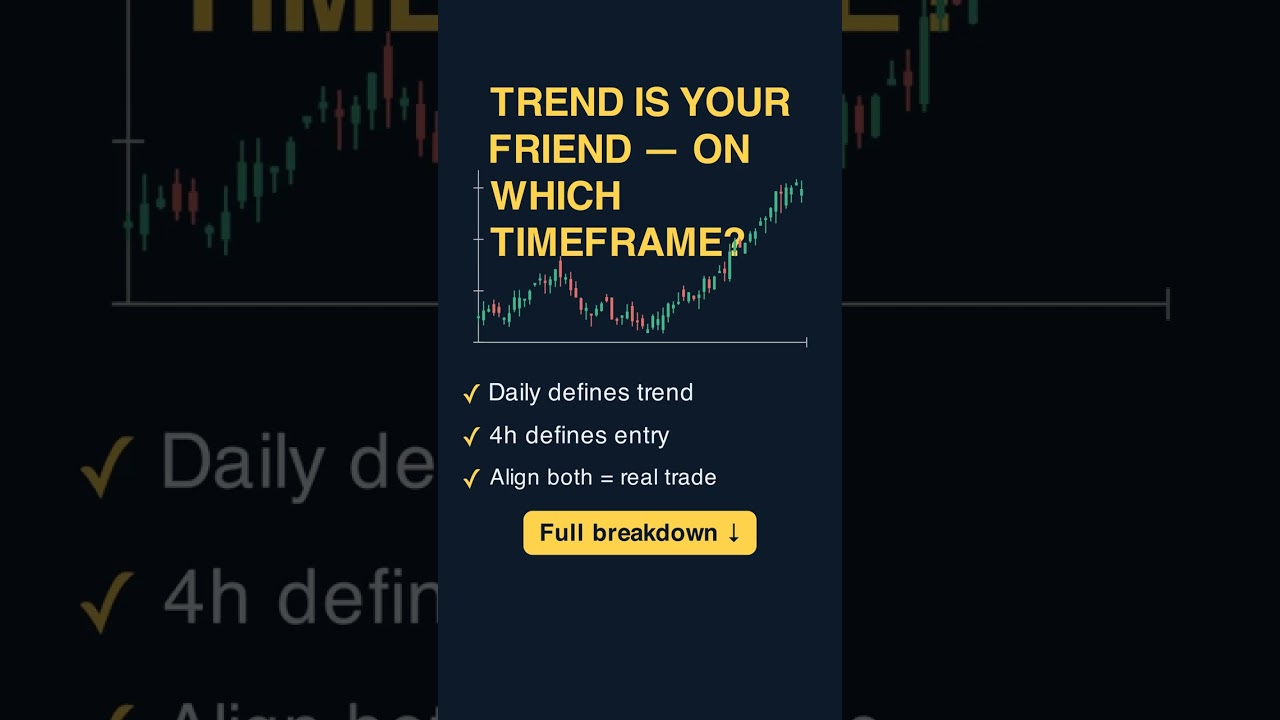
Most swing traders die on the wrong timeframe. We break down the top-down framework — weekly bias, daily trigger, four-hour entry — the rule that keeps you from fighting the trend, and the trap of confirmation-stacking.
Most trend lines are drawn on noise, not signal — and break almost immediately. We break down what makes a trend line VALID (three touches, real swing structure, appropriate timeframe), the trap of drawing lines that look right but aren't, and how to combine trend lines with horizontal levels for confluence entries that hold.
Volume is the conviction behind price: why breakouts need volume, how rising volume confirms a trend, and how to spot the low-volume move that's about to fail. Part of the momentum signal in the Confluence Method.
Market structure decoded: higher highs and higher lows define a trend, break of structure signals the shift, and change of character warns first. The price-action signal of the Confluence Method.
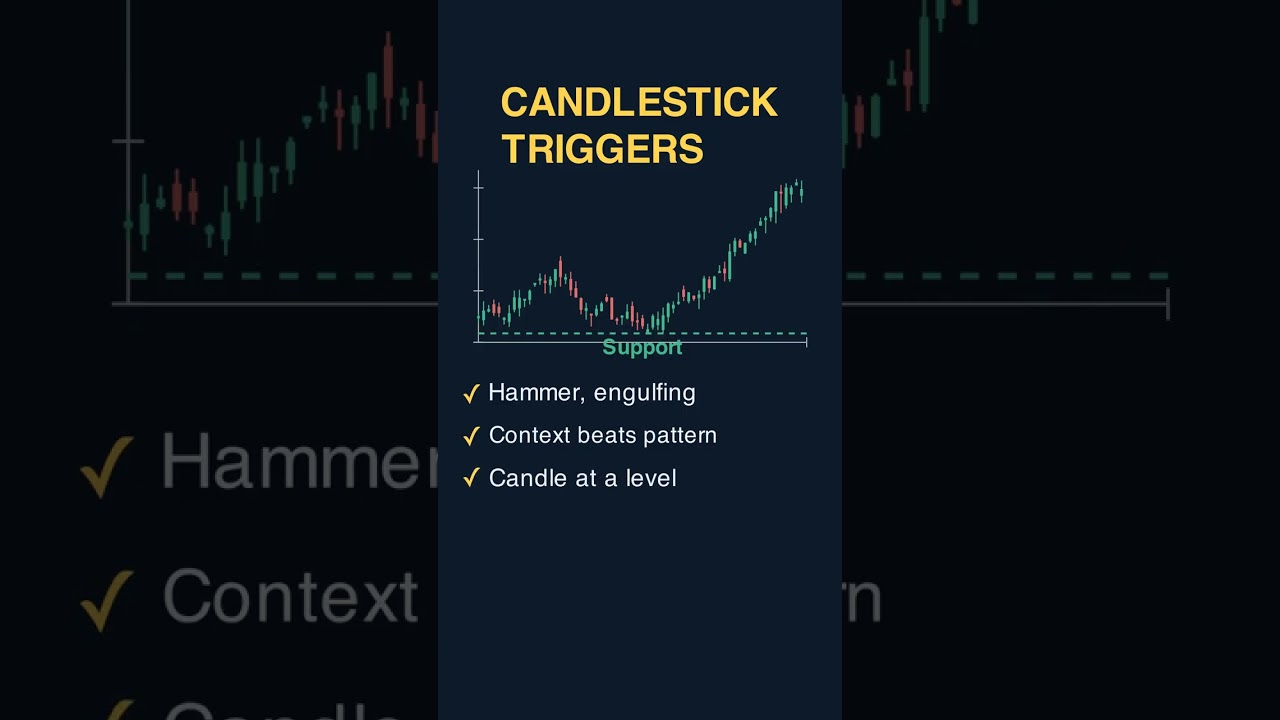
Candlestick triggers that work: hammer, engulfing, shooting star and doji — and why they only matter at a key level, never in the middle of nowhere. The trigger signal of the Confluence Method.
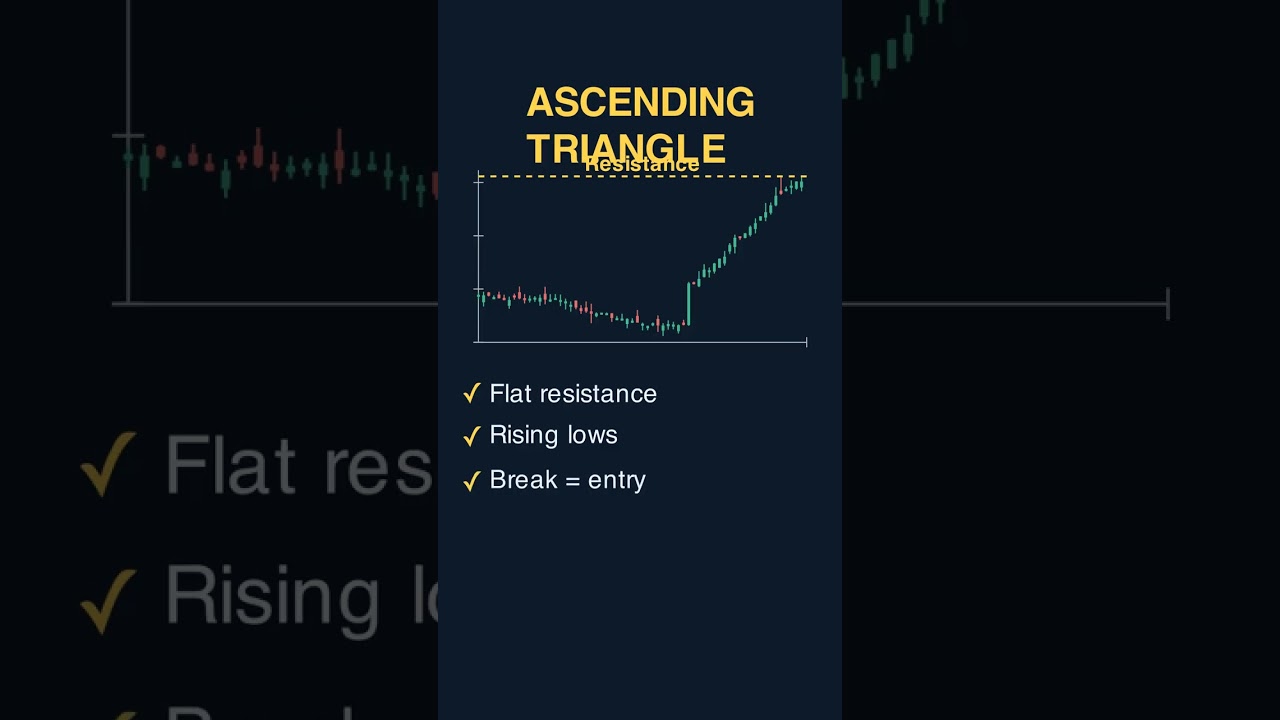
The ascending triangle: a flat resistance, rising lows, and the breakout that follows. Anatomy, the entry/stop/target, the early-entry trap, and a real chart.
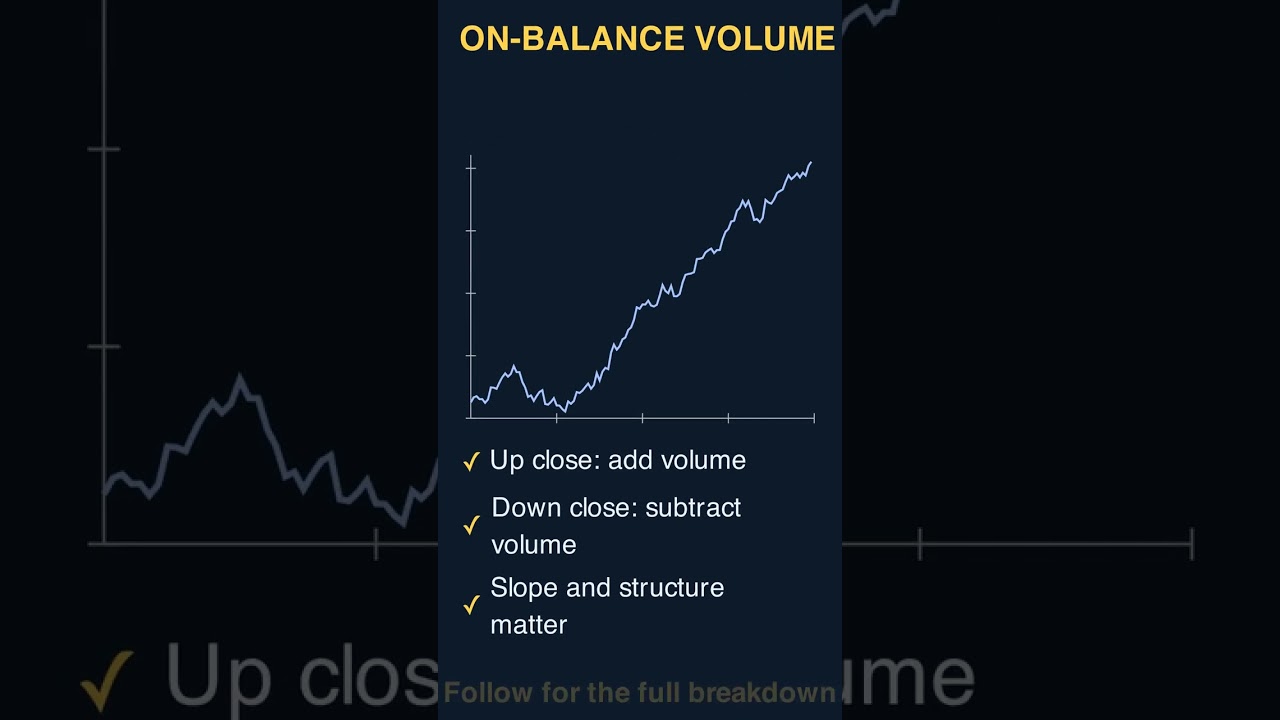
On-Balance Volume: Reading Accumulation Before Price Moves OBV is one of the most-used — and most-misused — tools in technical analysis. In this episode we break it down for serious traders: the intuition and the math, how to read it, real entry and exit signals, an analogy that makes it click, a worked example, and the pitfalls to avoid.
The pullback entry: in a healthy uptrend, buy the dip into the rising moving average instead of chasing the breakout. Anatomy, the exact entry/stop/target, the falling-knife trap, and a real chart.
The double bottom reversal: two tests of support, the neckline that confirms it, the measured-move target, and the trap of front-running the breakout. With a real chart.
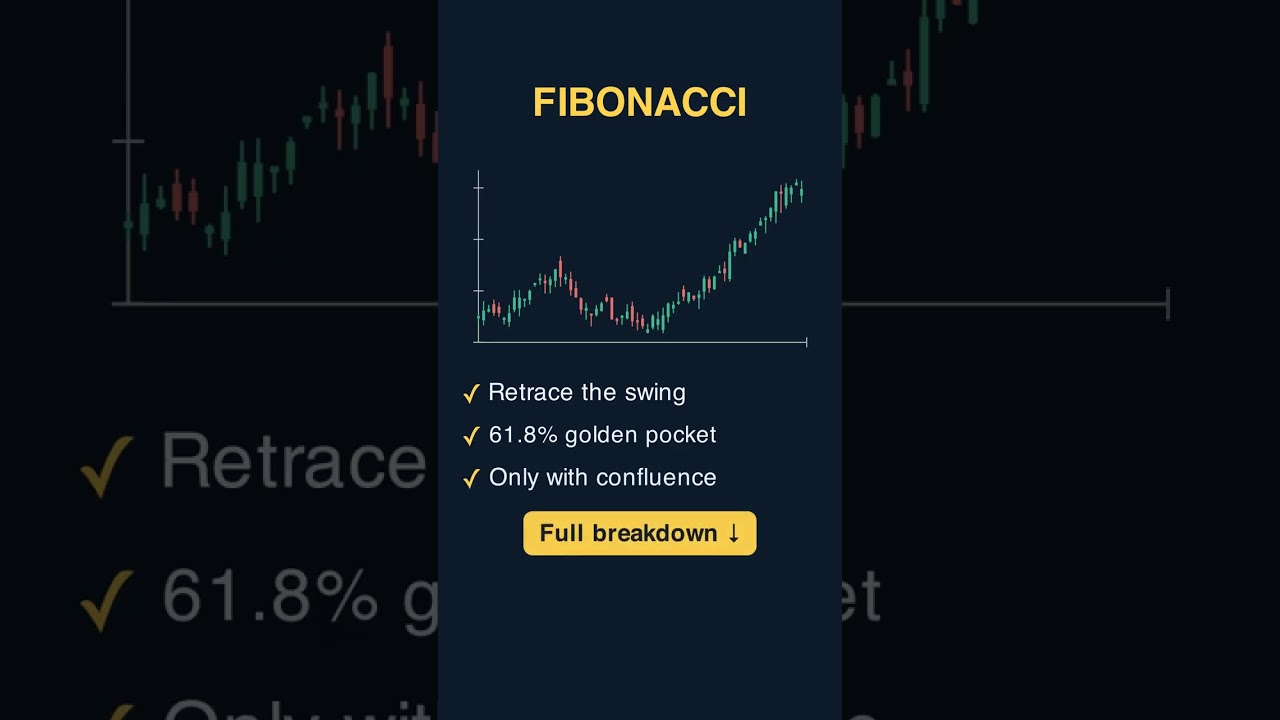
The Confluence Method: a swing trade only qualifies when four signals stack — price action/structure, a key level, momentum, and a trigger — run through one workflow: Scan, Stack, Execute, Review. Shown on animated charts and a real ticker.
Indicator-Confirmed Chart Patterns: Filtering the Noise OBV is one of the most-used — and most-misused — tools in technical analysis. In this episode we break it down for serious traders: the intuition and the math, how to read it, real entry and exit signals, an analogy that makes it click, a worked example, and the pitfalls to avoid.
May 2026 watchlist via the Confluence Method screener: 5 S&P 500 stocks that passed all four signals — price action above a rising 50-day, breakout above the 60-day high, RSI 50-70 and rising, and a volume-confirmed trigger candle — plus 5 high-flying names every other channel will list that the method rejects (all for the same reason: RSI extended). Educational only, not financial advice.
CCI: Spotting Cyclical Extremes CCI is one of the most-used — and most-misused — tools in technical analysis. In this episode we break it down for serious traders: the intuition and the math, how to read it, real entry and exit signals, an analogy that makes it click, a worked example, and the pitfalls to avoid.
Stochastic RSI: Momentum of Momentum Stochastic RSI is one of the most-used — and most-misused — tools in technical analysis. In this episode we break it down for serious traders: the intuition and the math, how to read it, real entry and exit signals, an analogy that makes it click, a worked example, and the pitfalls to avoid.
RSI: The Overbought Trap and Divergence RSI is one of the most-used — and most-misused — tools in technical analysis. In this episode we break it down for serious traders: the intuition and the math, how to read it, real entry and exit signals, an analogy that makes it click, a worked example, and the pitfalls to avoid.
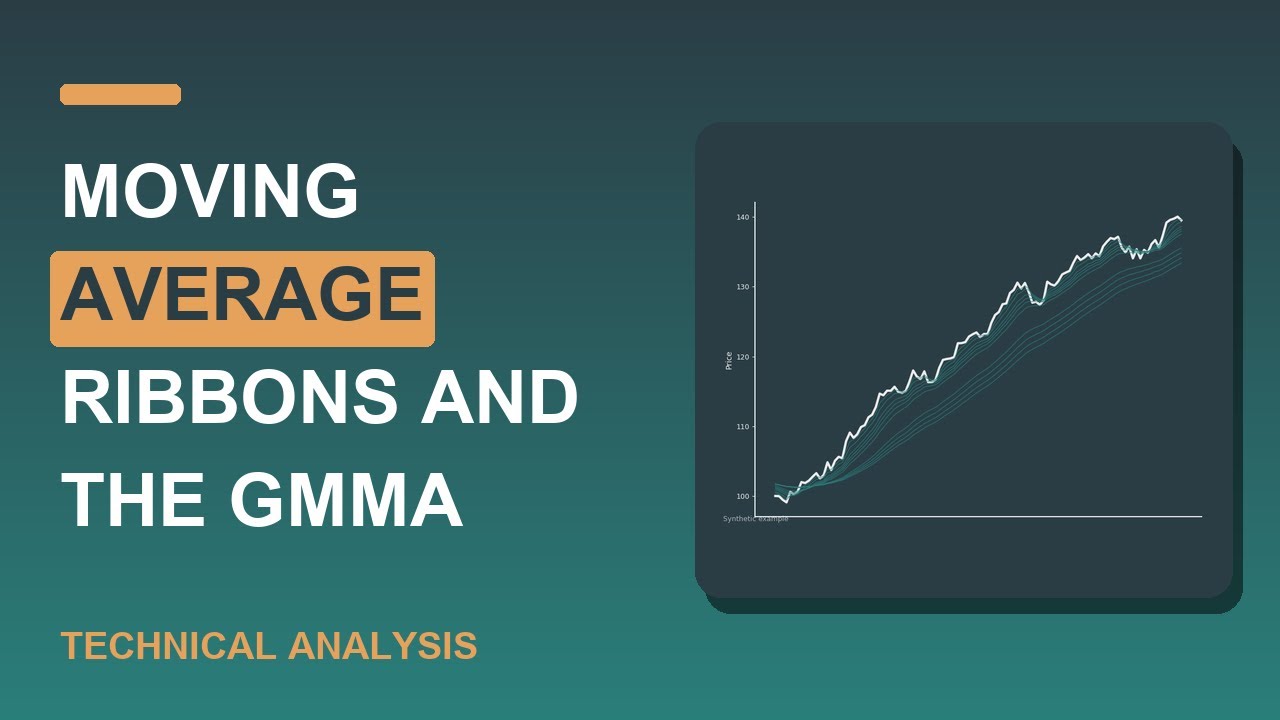
Moving Average Ribbons and the GMMA Moving Average Ribbon is one of the most-used — and most-misused — tools in technical analysis. In this episode we break it down for serious traders: the intuition and the math, how to read it, real entry and exit signals, an analogy that makes it click, a worked example, and the pitfalls to avoid.
The Accumulation/Distribution Line: Reading the Footprints of Smart Money Accumulation/Distribution is one of the most-used — and most-misused — tools in technical analysis. In this episode we break it down for serious traders: the intuition and the math, how to read it, real entry and exit signals, an analogy that makes it click, a worked example, and the pitfalls to avoid.
The Bollinger Band Squeeze: Trading Volatility Compression Bollinger Bands is one of the most-used — and most-misused — tools in technical analysis. In this episode we break it down for serious traders: the intuition and the math, how to read it, real entry and exit signals, an analogy that makes it click, a worked example, and the pitfalls to avoid.
Donchian Channels and the Turtle Breakout Donchian Channels is one of the most-used — and most-misused — tools in technical analysis. In this episode we break it down for serious traders: the intuition and the math, how to read it, real entry and exit signals, an analogy that makes it click, a worked example, and the pitfalls to avoid.
Keltner Channels vs Bollinger Bands: The Volatility Duel Bollinger Bands is one of the most-used — and most-misused — tools in technical analysis. In this episode we break it down for serious traders: the intuition and the math, how to read it, real entry and exit signals, an analogy that makes it click, a worked example, and the pitfalls to avoid.
Rate of Change: Reading Pure Price Momentum Rate of Change is one of the most-used — and most-misused — tools in technical analysis. In this episode we break it down for serious traders: the intuition and the math, how to read it, real entry and exit signals, an analogy that makes it click, a worked example, and the pitfalls to avoid.
Bollinger Bands: Mean Reversion and Trend Bollinger Bands is one of the most-used — and most-misused — tools in technical analysis. In this episode we break it down for serious traders: the intuition and the math, how to read it, real entry and exit signals, an analogy that makes it click, a worked example, and the pitfalls to avoid.
Williams %R Explained: An Advanced Trader's Guide Williams %R is one of the most-used — and most-misused — tools in technical analysis. In this episode we break it down for serious traders: the intuition and the math, how to read it, real entry and exit signals, an analogy that makes it click, a worked example, and the pitfalls to avoid.
MACD Deep Dive: Crossovers, Histogram, and the Lag Problem MACD is one of the most-used — and most-misused — tools in technical analysis. In this episode we break it down for serious traders: the intuition and the math, how to read it, real entry and exit signals, an analogy that makes it click, a worked example, and the pitfalls to avoid.
Double RSI Trading Strategy 2025: How to Win Without Losses in Forex, Stocks & Crypto 📈 Looking for a high-accuracy trading strategy that minimizes losses and maximizes wins? The Double RSI strategy is one of the most effective ways to filter out false signals, confirm strong trends, and improve trade execution.
Indicator-Confirmed Chart Patterns. Fast trading lessons in under 30 seconds — indicators, ICT smart-money concepts, and real setups for stocks and futures.
The descending triangle: flat support, lower highs, and the breakdown that follows — the bearish mirror of the ascending triangle. Anatomy, entry/stop/target, the early-entry trap, and a real chart.
The bear flag: a sharp drop, a weak upward drift, then continuation lower. The mirror of the bull flag — anatomy, the breakdown trigger, entry/stop/target, and the short-squeeze trap.
Moving Average Ribbons and the GMMA. Fast trading lessons in under 30 seconds — indicators, ICT smart-money concepts, and real setups for stocks and futures.
Welcome to Stock Market Method. We teach the Confluence Method — the four-signal framework that filters 90 percent of bad trades out: price action, a key level, momentum, and a trigger that has to fire before you commit a cent.
Think you're a trading expert? Put your skills to the test with this quick and intriguing riddle about trading!
Triggers — FAQ
What is the difference between a setup and a trigger?+
A setup is the context — structure, level, and momentum aligned on your watchlist. A trigger is the actual entry event (a candle close, a reclaim, a breakout) that turns that context into a position with a defined stop.
Why wait for a trigger at all?+
The trigger times the entry and anchors the stop, which is what makes risk measurable. Entering before the trigger means guessing, and guessing has no repeatable edge.
One concise email when a new lesson drops — plus the occasional breakdown you won't find on YouTube. No spam, unsubscribe anytime.
We use privacy-friendly analytics (Google Analytics & Microsoft Clarity)
to understand what's useful and improve the lessons. No cookies or tracking
are set until you accept. See our
privacy notice.
 3:24
3:24