Building Indicator Confluence: Stacking Edge Without Stacking Noise | Technical Analysis
TL;DR
Building Indicator Confluence: Stacking Edge Without Stacking Noise Moving Averages is one of the most-used — and most-misused — tools in technical analysis. In this episode we break it down for serious traders: the intuition and the math, how to read it, real entry and exit signals, an analogy that makes it click, a worked example, and the pitfalls to avoid.
“Building Indicator Confluence: Stacking Edge Without Stacking Noise Moving Averages is one of the most-used — and most-misused — tools in technical analysis. In this episode we break it down for serious traders: the intuition and the math, how to read it, real entry and exit signals, an analogy that makes it click, a worked example, and the pitfalls to avoid.”Click to post on X ▸
Where this fits in the Confluence Method
This lesson lives in the Stack step of the Confluence Method, where you confirm price action and structure, momentum and a trigger before a setup qualifies as a trade.
Read the full method ▸Full transcript
12 sections0:04Every indicator lies. Sometimes moving averages lag, oscillators whipssaw, breakouts fail. Confluence is how professional traders survive that noise. Instead of trusting a single line on a chart, you require multiple independent witnesses to agree before risking capital. Done right, Confluence raises your win rate and shrinks your draw downs. Done wrong, it just multiplies the same bad signal three times. Today we build a framework that does the former and avoids the latter. Confluence is not just using many indicators. It is requiring that signals from independent sources of information align at the same price and time. The key word is independent. Two moving averages aren't two witnesses. They are the same witness wearing different hats. Real confluence draws from different statistical families. Trend, momentum, volatility, and volume. When those families disagree, you stand down. When they agree, you have an edge worth pressing.
1:01Think of a trade like a criminal trial. You're the prosecutor, and you need to convict the market of trending up before you risk capital. One witness alone isn't enough, especially if that witness has a history of lying. So, you call a trend witness, a momentum witness, and a volume witness. If all three independently testify to the same story, the jury convicts. If two contradict each other, you drop the case.
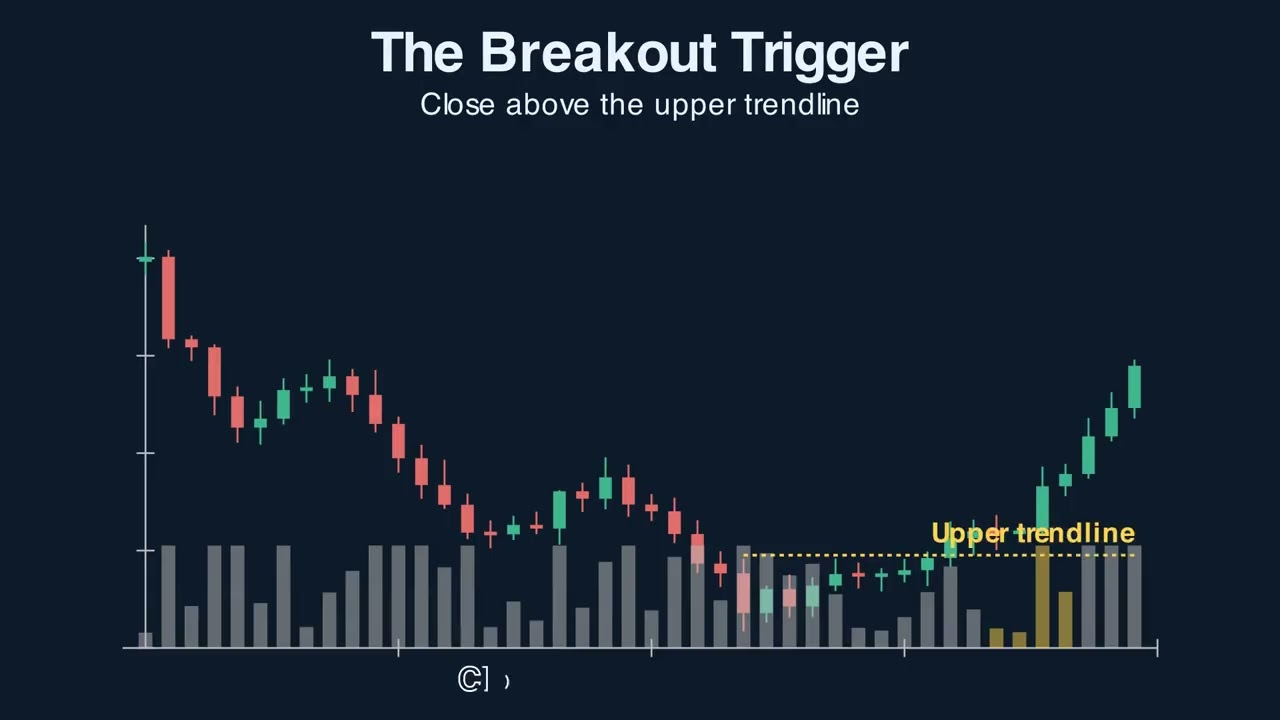
1:25Confluence is just sound courtroom procedure applied to charts. Start with a trend filter. This answers one question. Am I allowed to be long? A simple 50 and 200 period moving average stack works. Price above both with the 50 above the 200 means longs are permitted. Below means shorts only.
1:44Notice we're not entering on this. We're gating with it. This single rule eliminates roughly half of all bad trades because counter trend reversion setups die fast in strong trends. Once trend permits a direction, momentum picks the timing. RSI, stochastic, or MCD all work, but pick one, not three.
2:02In an uptrend, you're looking for RSI to dip toward 40 and turn back up. That's a pullback inside strength, not a top. The math matters here. RSI measures the ratio of up closes to down closes over your look back. In a real trend, that ratio rarely collapses below 30 before buyers return. The third witness comes from a completely different data stream.
2:25Volume-based tools like OBV or money flow read the tape behind the price. Volatility tools like ATR or Ballinger bands measure dispersion. These cannot lie the same way price derived oscillators do because they're computing something fundamentally different. If price breaks higher with OBV rising and ATR expanding, your three witnesses agree that's a high conviction setup.
2:48Here's where most traders sabotage themselves. They stack RSI, stochastic, and CCI on one chart and call it confluence. It isn't. All three are price-based oscillators with correlations above 85%. They will fire together by construction. That's not three witnesses. That's one witness shouting three times. Audit your toolkit by asking what each indicator actually measures. If two answer the same question, delete one. Here's the playbook on a synthetic chart. Price is above the 50 and 200 EMAs. So trend permits longs. We wait for a pullback.
3:23RSI dips to 42 and hooks up. Super trend remains green throughout the pullback. Our volatility aware confirmation. Entry triggers on the next bar's high above the pullback bar. Stop sits below the swing low. The signal would fail and we stand down if super trend flipped red during the pullback because two of three witnesses now disagree. The highest grade confluence signal is divergence aligned with structure. When price makes a lower low but momentum makes a higher low at a known support zone, you have three independent witnesses pointing at the same reversal. Structure, momentum, and the divergence itself. This is rare.
4:02Don't manufacture it. But when it appears at a major level, position sizing can be larger because the probability skew is genuinely better. Look at Apple over the last year. Notice where the 50-day rises above the 200-day. From that moment forward, only long setups qualify. Each pullback that holds the 50-day with MCD curling back above its signal line produced a tradable continuation. The pullbacks where MCD failed to curl or where price closed below the 50 are the ones you skip. Same chart, same indicators, but the rules force selectivity. Add a second axis. Time. A signal on the 4hour that aligns with the daily trend is stronger than one that contradicts it.
4:44Top-down analysis means the higher time frame sets the bias and the lower time frame sets the trigger. When both time frames show momentum turning in the same direction at the same structural level, you have temporal confluence on top of indicator confluence. That's the institutional view. Codify it. Give each witness a point. Trend aligned, one point. Momentum trigger, one point.
5:07Volume or volatility confirms, one point. Higher time frame agrees, one point. At key level, one point. Only take trades scoring four or five out of five. This forces discipline and gives you a journal variable to test. After 100 trades, you'll see whether fivepoint setups truly outperform threepoint setups, and you can refine accordingly.
5:27Three traps. First, paralysis. Requiring six confirmations means you never trade. Three solid witnesses is plenty. Second, curve fitting. Tuning every parameter until your backist is perfect produces a system that fails live. Keep setting standard. Third, confirmation bias. Once you're in a trade, you'll see confluence everywhere supporting it. Define your rules before entry. Write them down and follow them mechanically once price is moving. Tomorrow, open your platform and audit your current chart. Group every indicator by what it measures. Delete duplicates until you have one trend tool, one momentum tool, and one volume or volatility tool. Write a five-point checklist for the next 20 trades. Log the score and the outcome. You'll learn more from that exercise than from any new indicator you could add. This is education, not financial advice. Trade your own plan. Manage your own risk. If this helped, do me a favor. Hit the like button, subscribe, and tap the bell so you don't miss the next one. See you in the next