ICT IPDA: The Algorithm Behind Every PD Array | ICT Concepts
TL;DR
The Interbank Price Delivery Algorithm is the 'why' behind every PD array. We break down the 20/40/60-day lookback, why the algorithm seeks liquidity, and how IPDA changes the way you read every chart.
“The Interbank Price Delivery Algorithm is the 'why' behind every PD array. We break down the 20/40/60-day lookback, why the algorithm seeks liquidity, and how IPDA changes the way you read every chart.”Click to post on X ▸
Where this fits in the Confluence Method
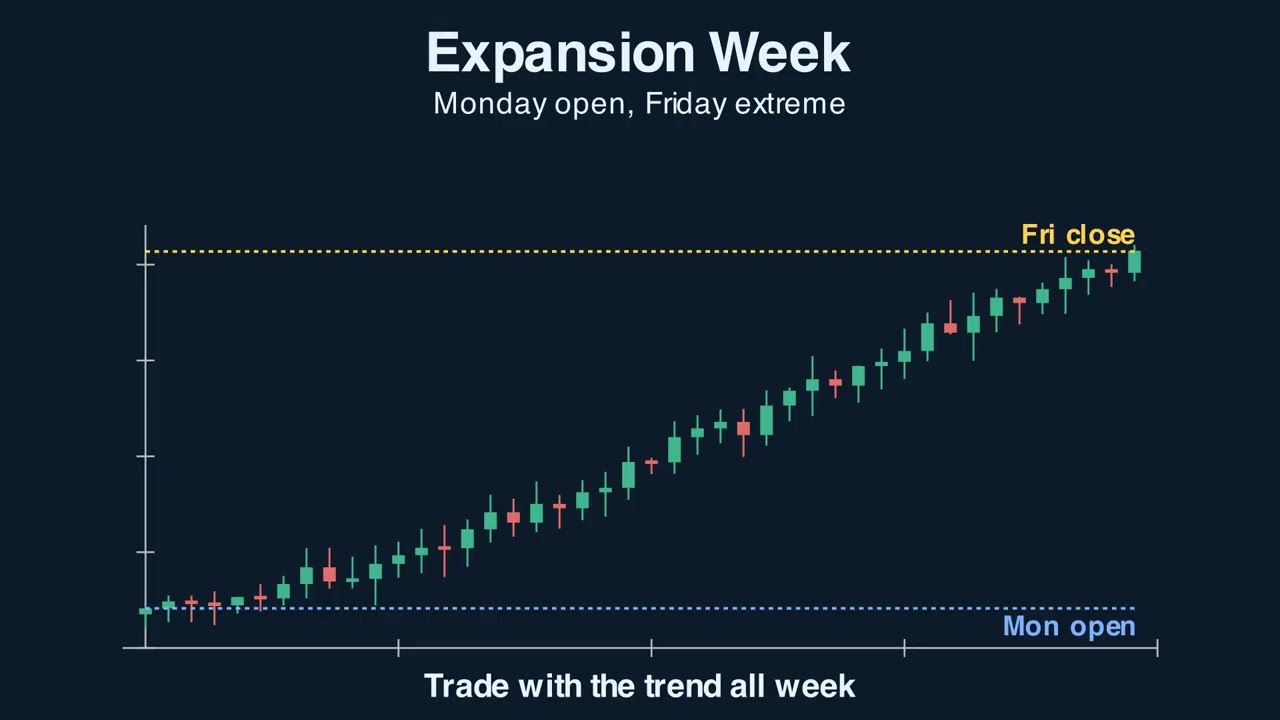
This lesson lives in the Stack step of the Confluence Method, where you confirm a key level before a setup qualifies as a trade.
Read the full method ▸Full transcript
7 sections0:00Charts aren't random and they aren't moved by traders' opinions. Price is delivered by an algorithm — ICT calls it the Interbank Price Delivery Algorithm, or IPDA — and every fair value gap, order block, and liquidity sweep you trade is downstream of how it works. Today we'll lift the hood: the 20/40/60-day lookback the algorithm uses, why it seeks liquidity and inefficiency, and how understanding IPDA changes the way you read every level on the chart.
0:29Here's IPDA's memory. The algorithm references three lookback windows simultaneously: twenty days, forty days, and sixty days. At each lookback, it sees the highest high, the lowest low, and the unfilled inefficiencies — the fair value gaps and liquidity voids it never came back to fill. These aren't your levels; they're the algorithm's levels. And the algorithm's job is to route price toward whichever of those liquidity points is the next draw. Understanding that turns abstract chart theory into a predictive map.
1:02Here is the principle that makes IPDA actionable. The algorithm has only two real objectives: collect liquidity and rebalance inefficiency. Liquidity sits at obvious highs and lows where stops cluster — that's the fuel. Inefficiency sits inside fair value gaps where price moved too fast to be fair — that's the obligation to come back. Every move you see is the algorithm choosing between hitting a liquidity pool above, hitting one below, or returning to fill an old inefficiency. Read the chart through that lens and the moves stop looking random.
1:35Watch this in practice. The twenty-day high sits above current price, and it hasn't been swept yet — liquidity is parked there in the form of breakout-trader stops. The algorithm sees that pool as a draw, and even if there's an unfilled FVG below, the priority becomes routing price up to the unswept high first. Track the unswept twenty/forty/sixty-day highs and lows on every chart, and you have IPDA's likely next target written in the open.
2:03Now the trap, because traders hear about IPDA and try to trade it directly. IPDA is not a setup. It's the why behind setups. Knowing the algorithm is reaching for the sixty-day high doesn't tell you where to enter — it tells you what the higher-probability direction is. You still need a setup at a discount, a fair value gap to enter on, a structure shift to confirm. IPDA frames the trade; your existing entry rules execute it. Use it as a filter, not a signal.
2:32Walk through any NQ chart and the IPDA framework reveals itself. Mark the highs and lows from twenty, forty, and sixty trading days back. The unswept ones are the magnets — the algorithm's next likely targets. The swept ones are spent. Add the unfilled fair value gaps inside the lookback. Suddenly the chart has a real map: this is where price came from, this is where it's heading, and these are the obligations the algorithm has to fill along the way. Build that habit and your bias stops being a guess.
3:04So: IPDA is the algorithm that delivers price, and it sees the chart through a twenty, forty, sixty-day lens. It seeks two things — liquidity to collect and inefficiency to rebalance. Mark the unswept highs and lows of each lookback and add the unfilled gaps, and you've got the algorithm's likely path written in front of you. Don't trade IPDA directly; use it to frame the trades your other rules deliver. Subscribe for the full method, and trade your own plan. Education, not financial advice.